Download presentation
Presentation is loading. Please wait.

1
Phase diagrams for melting in the Earth (101): thermodynamic fundamentals Jan Matas Université de Lyon Ecole normale supérieure de Lyon, CNRS CIDER 2010
: thermodynamic fundamentals Jan Matas Université de Lyon Ecole normale supérieure de Lyon, CNRS CIDER 2010")
2
Outer Core Mantle Continental Crust Base of lithosphere Oceanic Crust Ocean Plume Mid- ocean Ridge Inner core solidification (cf Jie Li) Basal magma ocean Labrosse et al. 2007 Metling in the Earth Jie Li (CIDER 2010)
.")
3
Pyroxene (Ca,Mg,Fe)(Mg,Fe,Al)(Al,Si) 2 O 6 Olivine (Mg,Fe) 2 SiO 4 Garnet (Ca,Mg,Fe) 3 (Mg,Fe,Al,Si) 2 (Al,Si) 3 O 12 Natural samples: e.g. peridotite

4
Natural samples: e.g. pallasite metallic alloy (Fe, Ni, Si, S,...) olivine (Mg,Fe) 2 SiO 4
 olivine (Mg,Fe) 2 SiO 4")
5
Natural samples - global composition: Mg, Fe, Al, Ca, Si, Ni, S, O,... - macro-scale: assemblage of grains (each grain is a mineral) - micro-scale: each grain = (solid) solution a thermodynamic description requires end-members E.g.: (Mg x,Fe y ) 2 SiO 4 = xMg 2 SiO 4 + yFe 2 SiO 4
 - micro-scale: each grain = (solid) solution a thermodynamic description requires end-members E.g.: (Mg x,Fe y ) 2 SiO 4 = xMg 2 SiO 4 + yFe 2 SiO 4.")
7
Temperature ( o C) Wt. % Fayalite Fe 2 SiO 4 Mg 2 SiO 4 1100 1200 1300 1400 1500 1600 1700 1800 1900 L1 L2 L3 S1 S2 S3 LIQUID OLIVINE 1 atm = 0.1 MPa liquidus solidus X0X0 X1X1 X2X2 X3X3 “forbidden zone” T1 T2T2 T3 Temperature ( o C) 1100 1200 1300 1400 1500 1600 Diopside CaMgSi 2 O 6 Anorthite CaAl 2 Si 2 O 8 1 atm = 0.1 MPa LIQUID Anorthite + Diopside X (Wt. %) solidus liquidus L1 L3 L2 S1 S2 S3 X0X0 x1x1 x2x2 x3x3 T1 T3 T2 Eutectic Two diagrams, same thermodynamics Loop diagram Eutectic diagram cf … Cin-Ty Lee
 Diopside CaMgSi 2 O 6 Anorthite CaAl 2 Si 2 O 8 1 atm = 0.1 MPa LIQUID Anorthite + Diopside X (Wt. %) solidus liquidus L1 L3 L2 S1 S2 S3 X0X0 x1x1 x2x2 x3x3 T1 T3 T2 Eutectic Two diagrams, same thermodynamics Loop diagram Eutectic diagram cf … Cin-Ty Lee.")
8
Solid L+S Liquid A1A2 Temperature Composition A1A1 A1A1 Rabbit diagram

10
Ideal mixture: G*(mix)
")
11
BB AA xBxB AA BB Ideal mixing G*

12
A1A1 T P P3P3 P2P2 P1P1 P T X1X1 X2X2 X3X3

13
P P P X1X1 X3X3 X2X2 T T T solid liquid solid liquid s+l

14
Non-ideal mixing G*mix+G*ex W negative W positive

15
BB AA Non-ideal mixture G* inflection point

16
B1 = B2 A1 = A2 x B1 x B2 Non-ideal mixture G* inflection point

17
BB AA Non-ideal mixture G* inflection point TT xBxB

18
A1A1 A2A2 TCTC Temperature Composition Single mixture (A x B 1-x ) two coexisting phases (A x1 B 1-x1 ) et (A x2 B 1-x2 ) A B xx1 x2 stableinstable
 two coexisting phases (A x1 B 1-x1 ) et (A x2 B 1-x2 ) A B xx1 x2 stableinstable")
19
Liquid Solid L+S A1A2 B1B2 Temperature Composition A1A1 A A1A1 B A1A1 A’ A1A1 B’

20
Solid L+S Liquid A1A2 B1B2 Temperature Composition A1A1 A A1A1 B A1A1 A’ A1A1 B’

21
Solid L+S Liquid A1A2 B1B2 Temperature Composition A1A1 A A1A1 B A1A1 A’ A1A1 B’ Azeotropic minimum

22
Solid L+S Liquid A1A2 B1B2 Temperature Composition A1A1 A A1A1 B A1A1 A’ A1A1 B’

23
Liquid Solid L+S A1A2 B1B2 E Temperature Composition A1A1 A A1A1 B A1A1 A’ A1A1 B’

24
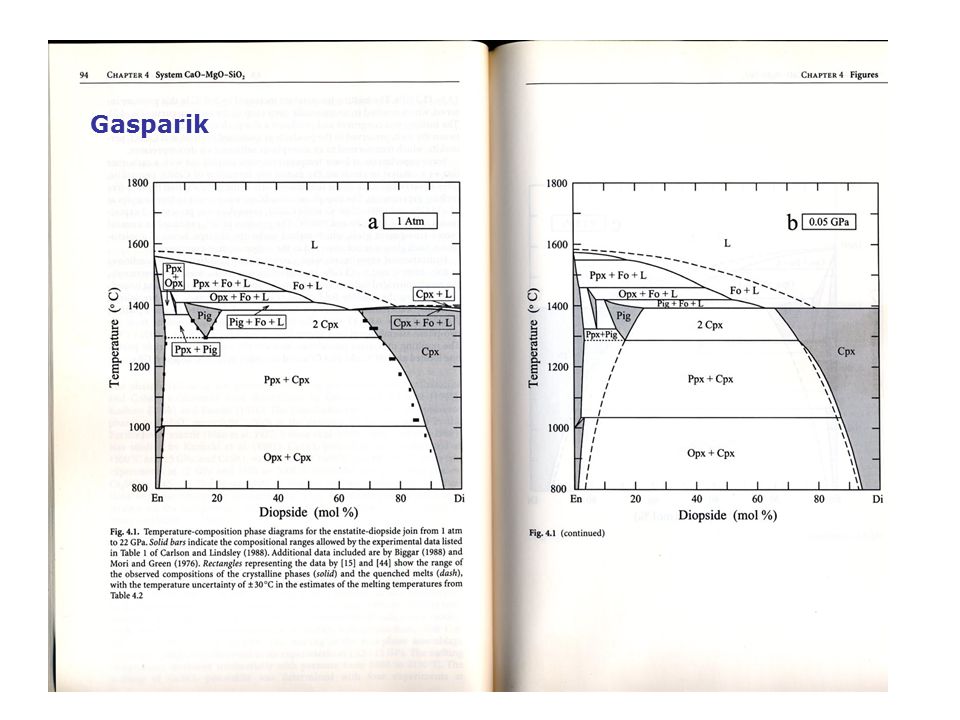
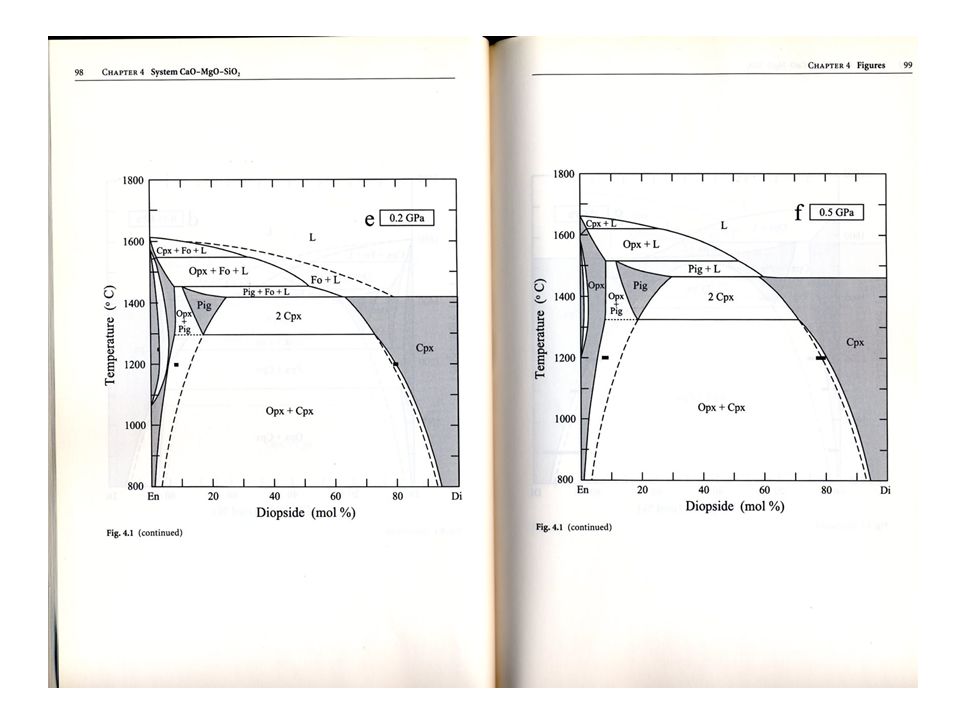
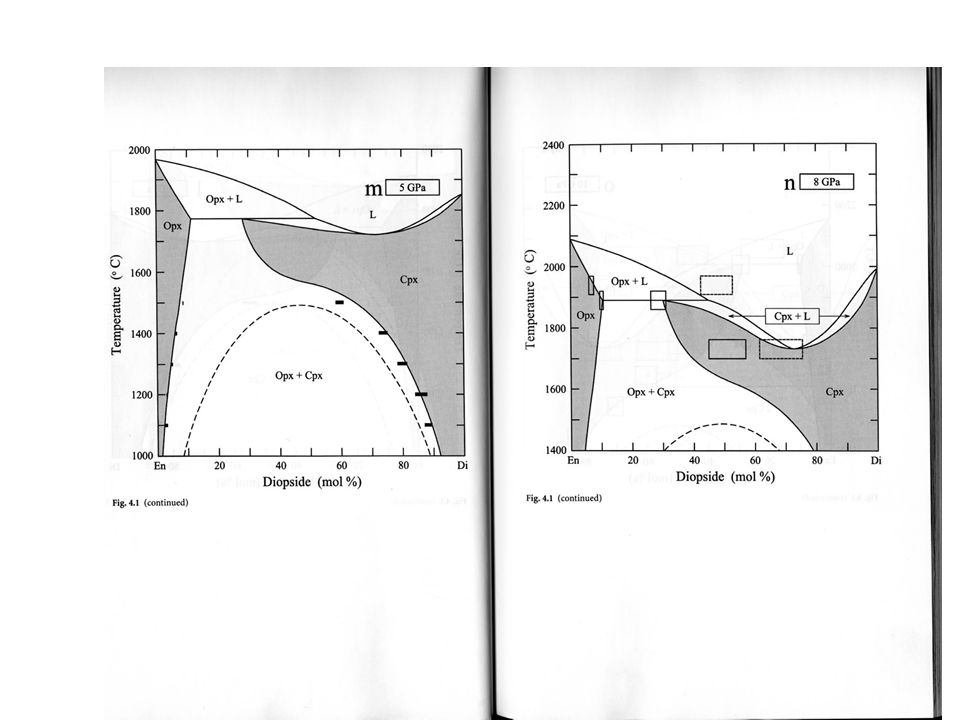
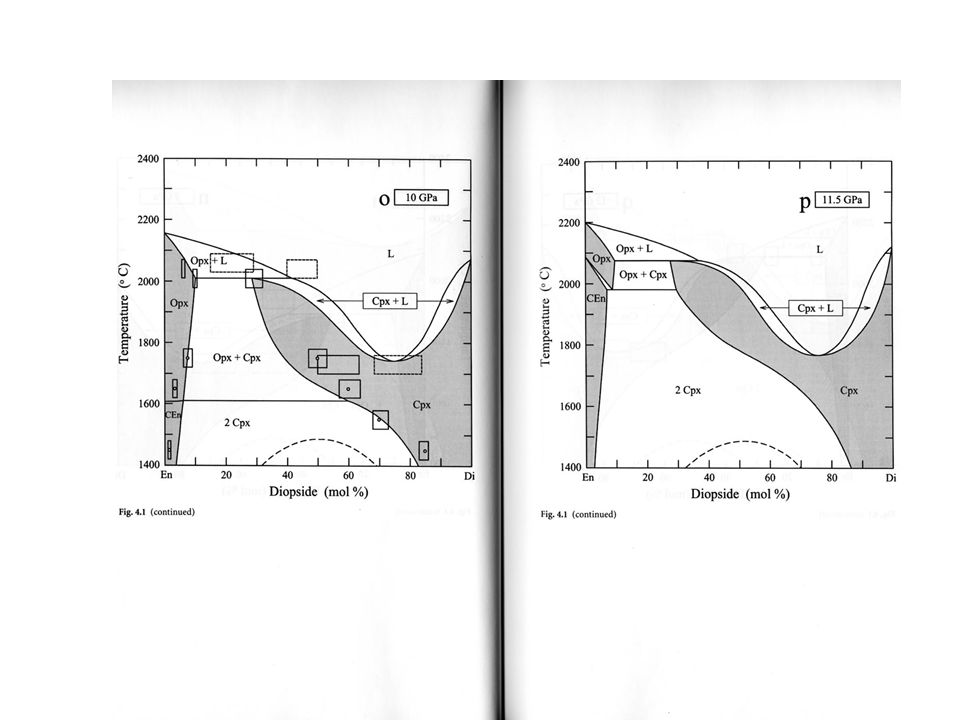
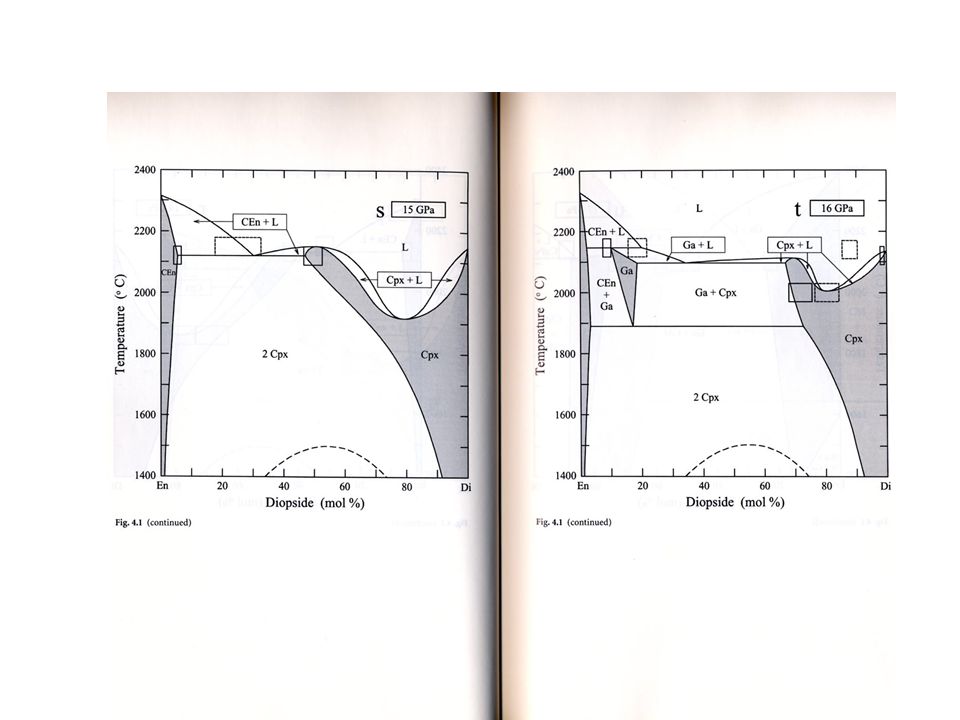
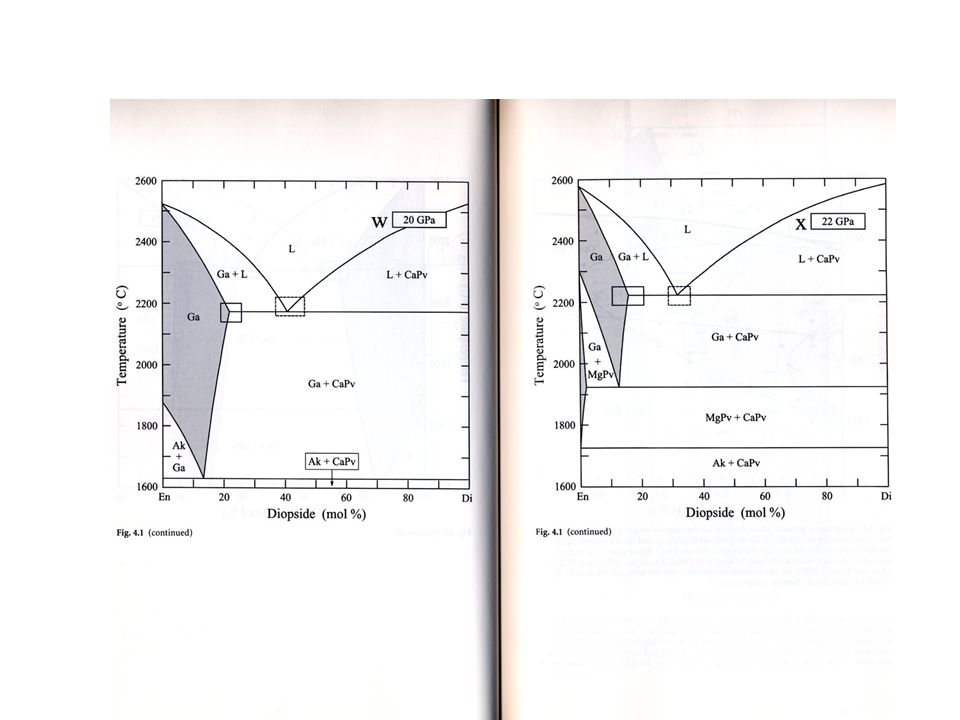
Gasparik

30
solidus Peritectic (Opx -> Cpx) Azeotropic minimu
 Azeotropic minimu")
33
Peritectic becomes eutectique

37
Evolution at the solidus

Similar presentations


>")


 of lherzolite Model for mid-ocean ridges 3.Melting in.>")
 and composition over which.>")


 , є > 0 AB is large avoid A-B bonds clustering, unmixing, phase separation.>")
 melt at a single temperature More complex compounds (like silicate magmas) have very.>")