Download presentation
Presentation is loading. Please wait.

1
Southern Willamette Valley 2011 Long-Term Groundwater Monitoring Results

2
Process of Selection Balance with other data

5
Originally established a network of 17 domestic and 26 monitoring wells

6
DW = Domestic Wells, generally deeper, used on a regular basis GW = Groundwater Monitoring Wells, generally shallower, purged only when sampled

7
What is being measured pH Specific Conductance Temperature Dissolved Oxygen Nitrate Sulfate (every other time)
")
8
Sampling Program occurs every 3 months (quarterly) DW Wells take about 2 days GW Wells take about 4-5 days 21 Quarterly events completed, next one is due in Nov. 2011

9
Changes to Program 2 DW wells were discontinued as they really did not reflect the shallow groundwater used by most GWMA residents (DW-4 & DW-14) One GW Well was dug out as part of a gravel operation (GW-14) Two GW Wells still hit and miss (GW-2 & GW-4S)
 One GW Well was dug out as part of a gravel operation (GW-14) Two GW Wells still hit and miss (GW-2 & GW-4S)")
10
Other Changes to Program After the USGS presentation, we decided that for selected wells, we would test for addition parameters along with the current limited suite of analyses More changes to come

11
Monitoring well __ Land Surface _______________________________________ --------- --------- --------- Depth to Water = 5 feet Depth to Water 15 feet Depth to bottom – usually 23 feet

12
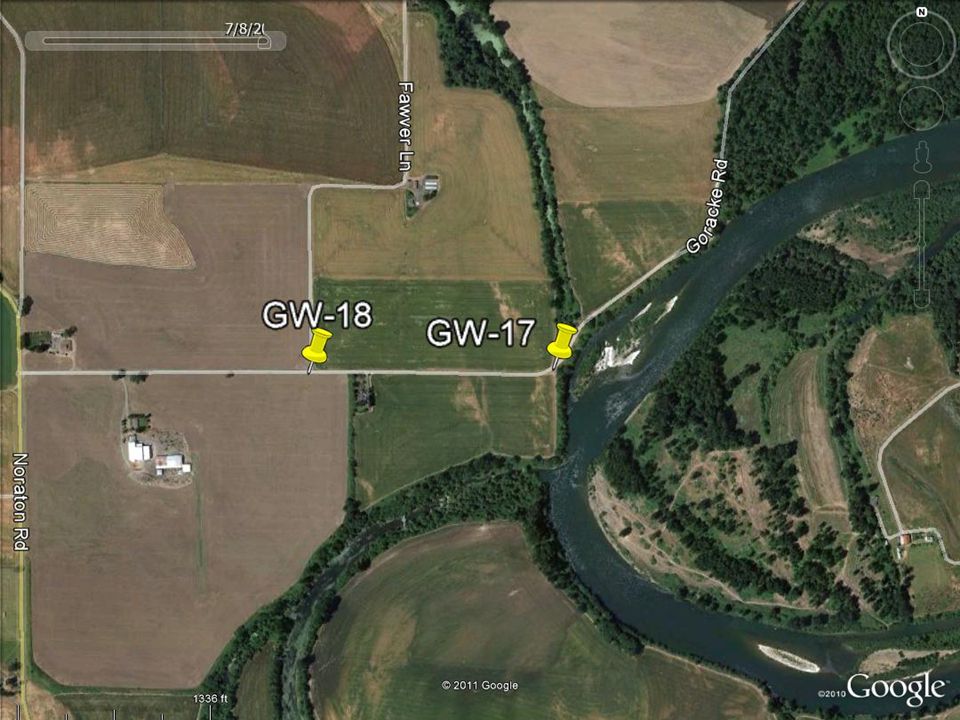
Over the years, there seems to be some water results from select wells that indicate we are seeing more surface-water influence than groundwater influence. Wells DW-2, DW-7, GW-16, GW17 and sometimes GW-5 are good examples

15
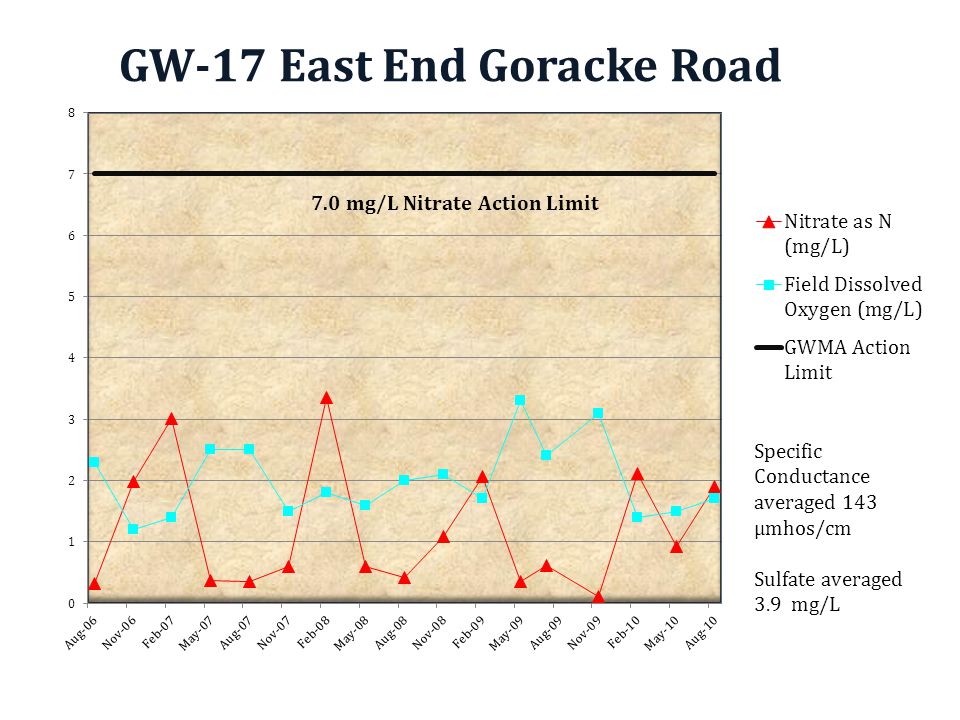
All high nitrate-N values in Feb or May All nitrate-N values <1.5 mg/L in Aug or Nov Lowest Spec. Cond. in Aug and Nov Depth to water greatest in Aug and Nov If this was mostly river water influenced – one might think the nitrate would be lowest when the river is the highest (Feb) and the DTW was the lowest (Feb and May)
 and the DTW was the lowest (Feb and May).")
17
Specific Conductance averaged 237 µmhos/cm Sulfate averaged 11.2 mg/L

21
WellNitrate-N Increase 2011 vs Increase 2010 Nitrate-N Decrease 2011 vs Decrease 2010 Nitrate-N Steady 2011/ Steady 2010 DW4 (2011) 1-2 (2010) 2 (2011) 7 (2010) 8 (2011) 5-6(2010) GW11 (2011) 7 (2010) 4 (2011) 7 (2010) 8 (2011) 9 (2010)
 1-2 (2010) 2 (2011) 7 (2010) 8 (2011) 5-6(2010) GW11 (2011) 7 (2010) 4 (2011) 7 (2010) 8 (2011) 9 (2010)")
25
What is a 0.71mg/L increase of N to the shallow groundwater equivalent to? Value Unit Average N increase in monitoring wells 0.71 mg/L Area of GWMA 220 mi 2 90% of area 198 mi 2 = 5.5E+09 square feet =126720 acre Average water column in wells Nov 2010-August 2011 12.8 ft

26
What is a 0.71mg/L increase of N to the shallow groundwater equivalent to? Value Unit Average N increase in monitoring wells 0.71 mg/L Area of GWMA 220 mi 2 90% of area 198 mi 2 = 5.5E+09 square feet =126720 acre Average water column in wells Nov 2010-August 2011 12.8 ft Average aquifer 'size' monitored by these wells Nov 2010 - Aug 2010 (yes - not the entire aquifer) 70,655,016,960 ft 3 Cubic feet to liter conversion 2.00073E+12 liters Multiply by average porosity of aquifer (30%) to get the volume of water in aquifer monitored by these wells 600,218,185,407 liters average volume of aquifer
 70,655,016,960 ft 3 Cubic feet to liter conversion E+12 liters Multiply by average porosity of aquifer (30%) to get the volume of water in aquifer monitored by these wells 600,218,185,407 liters average volume of aquifer.")
27
Monitoring well __ Land Surface _______________________________________ --------- --------- --------- Depth to Water = 5 feet Depth to Water 15 feet Depth to bottom – usually 23 feet

28
What is a 0.71mg/L increase of N to the shallow groundwater equivalent to? Value Unit Average N increase in monitoring wells 0.71 mg/L Area of GWMA 220 mi 2 90% of area 198 mi 2 = 5.5E+09 square feet =126720 acre Average water column in wells Nov 2010-August 2011 12.8 ft Average aquifer 'size' monitored by these wells Nov 2010 - Aug 2010 (yes - not the entire aquifer) 70,655,016,960 ft 3 Cubic feet to liter conversion 2.00073E+12 liters Multiply by average porosity of aquifer (30%) to get the volume of water in aquifer monitored by these wells 600,218,185,407 liters average volume of aquifer Mult by average GW increase in N = 0.71 mg/L 426,154,911,639 mg of N Convert mg to lbs 939,510 lbs of N Divide by 0.21 (Average N % of Ammonium Sulfate) 4,473,857 lbs of fertilizer equivalent increase in groundwater
 70,655,016,960 ft 3 Cubic feet to liter conversion E+12 liters Multiply by average porosity of aquifer (30%) to get the volume of water in aquifer monitored by these wells 600,218,185,407 liters average volume of aquifer Mult by average GW increase in N = 0.71 mg/L 426,154,911,639 mg of N Convert mg to lbs 939,510 lbs of N Divide by 0.21 (Average N % of Ammonium Sulfate) 4,473,857 lbs of fertilizer equivalent increase in groundwater.")
29
What is a 0.71mg/L increase of N to the shallow groundwater equivalent to? Value Unit Average N increase in monitoring wells 0.71 mg/L Area of GWMA 220 mi 2 90% of area 198 mi 2 = 5.5E+09 square feet =126720 acre Average water column in wells Nov 2010-August 2011 12.8 ft Average aquifer 'size' monitored by these wells Nov 2010 - Aug 2010 (yes - not the entire aquifer) 70,655,016,960 ft 3 Cubic feet to liter conversion 2.00073E+12 liters Multiply by average porosity of aquifer (30%) to get the volume of water in aquifer monitored by these wells 600,218,185,407 liters average volume of aquifer Mult by average GW increase in N = 0.71 mg/L 426,154,911,639 mg of N Convert mg to lbs 939,510 lbs of N Divide by 0.21 (Average N % of Ammonium Sulfate) 4,473,857 lbs of fertilizer equivalent increase in groundwater Average lbs of fertilizer lost per acre 35 lbs per acre equivalent
 70,655,016,960 ft 3 Cubic feet to liter conversion E+12 liters Multiply by average porosity of aquifer (30%) to get the volume of water in aquifer monitored by these wells 600,218,185,407 liters average volume of aquifer Mult by average GW increase in N = 0.71 mg/L 426,154,911,639 mg of N Convert mg to lbs 939,510 lbs of N Divide by 0.21 (Average N % of Ammonium Sulfate) 4,473,857 lbs of fertilizer equivalent increase in groundwater Average lbs of fertilizer lost per acre 35 lbs per acre equivalent.")
Similar presentations


 Narayan P. Pandit (FDC,>")


