Download presentation
Presentation is loading. Please wait.

1
Linking Borehole Temperatures to Air Temperatures Will Gosnold, Xiquan Dong, Shannon Heinle, Jacek Majorowicz, Julie Popham, Rachel Robinson, Brad Rundquist, Paul Todhunter This research is supported by National Science Foundation Award ATM - 0318384 Invited presentation at EGU - Vienna, April, 2006

2
Overview Introduction Research Plan Background and Theory Observations Results Conclusions

3
von Storch et al., 2004 The key to understanding climate forcing lies in linking the paleoclimate record with the modern meteorological record. However, the various methods do not appear to agree with the precision needed to quantify and distinguish among various forcing signals. Gosnold, Todhunter, and Schmidt, 1997

4
This project focuses on correlating borehole temperature profiles with the meteorological record. The ultimate objective is to correlate GST and SAT with the proxy records, solar irradiance and models of climate forcing.

5
Working Hypothesis Radiative heating and heat exchange between the ground and the air directly control the ground surface temperature A time-series of borehole T-z measurements spanning time periods when solar radiation, soil and air temperatures have been recorded will enable comparison of the thermal energy stored in the ground to these quantities.

6
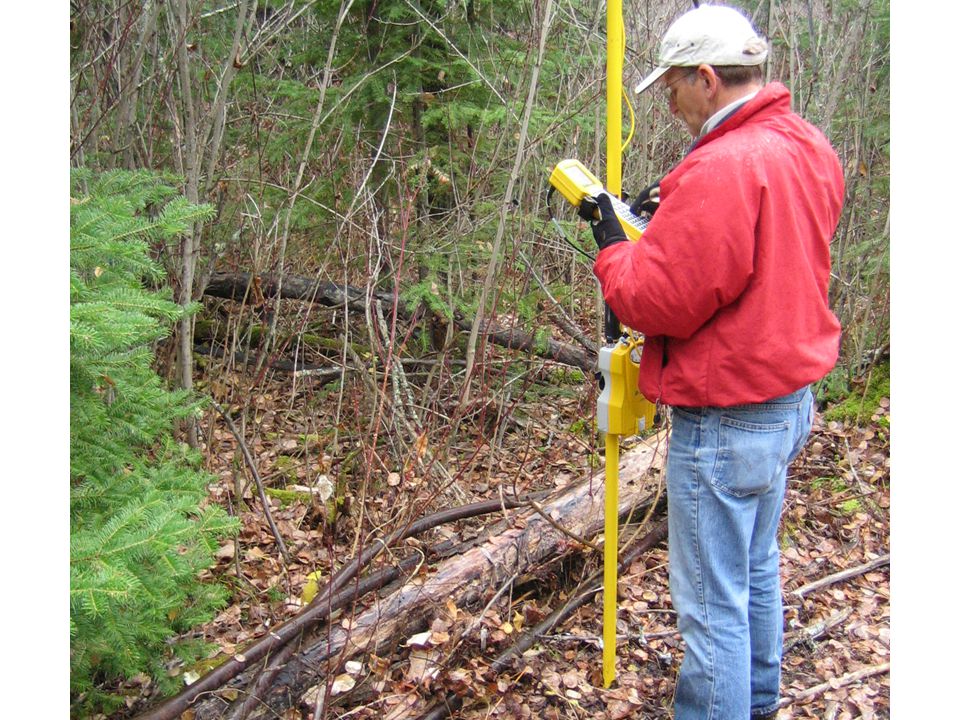
Research Plan Locate and relog boreholes. Obtain daily meteorological data from AWDN sites. Test short-period correlation of SAT and borehole T-z Correlate the long-term temperature record from deep boreholes with the meteorological record.

7
green boxes Borehole sites included in present study red circles, AWDN sites green boxes

8
A key reason for focusing on the mid-continent of North America is that climate varies with latitude as does change predicted by GCM’s using greenhouse gas forcing. Source: NOAA NCDC

9
Inversion of borehole T-z data to recover the GST indicates warming beginning about a century ago between 46N and 50N.

10
Binning GST by latitude shows a pattern consistent with GCM predictions based on greenhouse gas forcing of climate.

11
When we first tried this analysis, SAT and GST data did not agree when compared as change per century. Adjustment using a POM that minimized the misfit made the two data sets agree. (Harris and Gosnold, 1999) One of the difficulties in comparing GSTH and SAT is that the initial T-z profile is not known and is assumed to be undisturbed.
 One of the difficulties in comparing GSTH and SAT is that the initial T-z profile is not known and is assumed to be undisturbed..")
12
This study uses observed T-z profiles as the initial condition and the SAT as forcing signals. The profiles below are from North Dakota.

13
Multiple T-z logs from a site in Saskatchewan

14
Daily temperature record covering time span of borehole logs

19
Cochrane, Northern Ontario

20
green boxes Borehole sites included in present study red circles, AWDN sites green boxes

26
Results of short period test The short-period comparison of multiple observations of borehole data to climate data indicates that the boreholes accurately record trends in air temperatures. Do the T-z profiles modeled using 110 years of SAT data for agree with observed T-z profiles? To answer this question we used both monthly and annual temperature data from the US HCN and compared the results to boreholes logged at the appropriate times.

27
US Historical Climatology Network Stations with Daily and Monthly Data

28
Monthly Data from US HCN

29
Monthly data filtered by thermal diffusion

34
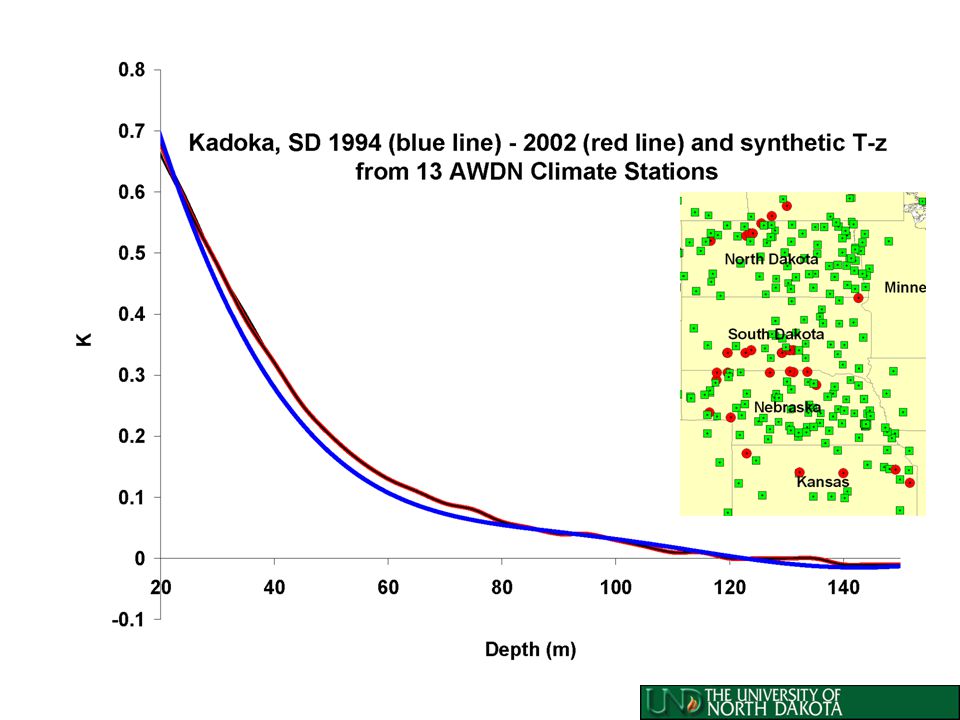
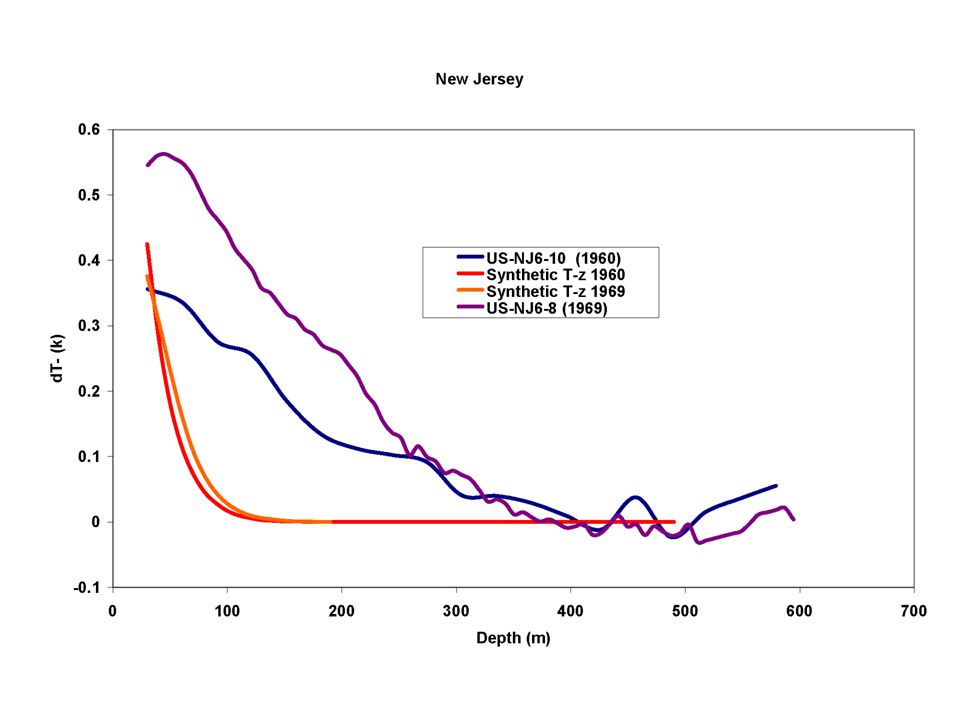
Synthetic T-z profiles based on 110 y of SAT forcing show nearly the same warming as the observed T-z profiles. Synthetic dT at 10 mObserved* dT at 10m MB 3.8°CMB 4.8°C ND 1.8°CND 1.9°C SD 1.4°C NE 0.9°CNE 0.7°C

35
Some observations on the global borehole data set Borehole Percentages-Possibly Problematic Boreholes Total boreholes examined in United States = 130 Boreholes with terrain effects = 33/130 = 25.38% Breakdown City/Urban effects = 6/130 = 4.615% Proximity to large bodies of water = 5/130 = 3.546% Hill Effects-Ravines, Valleys, Buttes = 16/130 = 12.308% Mining Operation = 3/130 = 2.308% Mixed Effects = 3/130 = 2.308%

39
Even with some non-climatic effects in the borehole data, the overall record appears to give a good record of air temperature changes during the critical period of significant anthropogenic climate forcing.

40
Conclusions We tested our basic hypothesis by synthesis of daily meteorological data from an array of 89 automated meteorological stations and repeat measurements of T-z profiles in boreholes initially logged ten to twenty-six years ago. Repeat temperature vs. depth measurements at a number of borehole sites over a 26 year period indicate that changes in borehole temperatures closely agree with changes in surface air temperatures and soil temperatures on multi-decade timescales. The tests show that subsurface temperatures contain an accurate record of the surface air temperature if precautions are taken to avoid terrain and non-climate related transient signals.

41
Linking Borehole Temperatures to Air Temperatures Will Gosnold, Xiquan Dong, Shannon Heinle, Jacek Majorowicz, Julie Popham, Rachel Robinson, Brad Rundquist, Paul Todhunter This research is supported by National Science Foundation Award ATM - 0318384

Similar presentations


 can be calculated from the T-Z profile using a non-linear Bayesian formulation based on the method.>")


. A candidate for causing.>")


 1. Is it warming? --climate proxy info (recap) -- info from historical & instrumental records 2. What.>")


 by direct comparison of.>")
