Download presentation
Presentation is loading. Please wait.

1
CBRFC June 2014 Water Supply Webinar June 5, 2014 Paul Miller These slides: www.cbrfc.noaa.gov/present/present.php

2
June Water Supply Webinar May Weather & Streamflow Snow Situation Water supply forecasts Upcoming weather and climate

3
May 2014 Upper Air Pattern WEEK-1: Calm weather and near average temps WEEK-2: Colder weather and storm activity, particularly in GB and UC regions WEEK-3: Warming temps in the north and less storm activity WEEK-4: Well-above average temps drove increases to streamflow rates Generally warmer and less stormy Generally cooler and more stormy Inconsistent geopotential heights across latitudes can mean: Plots available via: http://www.esrl.noaa.gov/psd/data/composites/ day/

4
Tower SNOTEL – May Accumulated Precipitation Storm activity in the region

5
Tower SNOTEL – May Temperature Warming in the region

6
May Streamflow

7
Precipitation

8
Temperatures

9
June 3 rd Snow Snow still prevalent in the Upper Colorado Headwater and Green River Basins Not much snow left in Eastern Great Basin or San Juan regions.

10
Snow in the CBRFC Hydrologic Model SWE as a percent of the model average

11
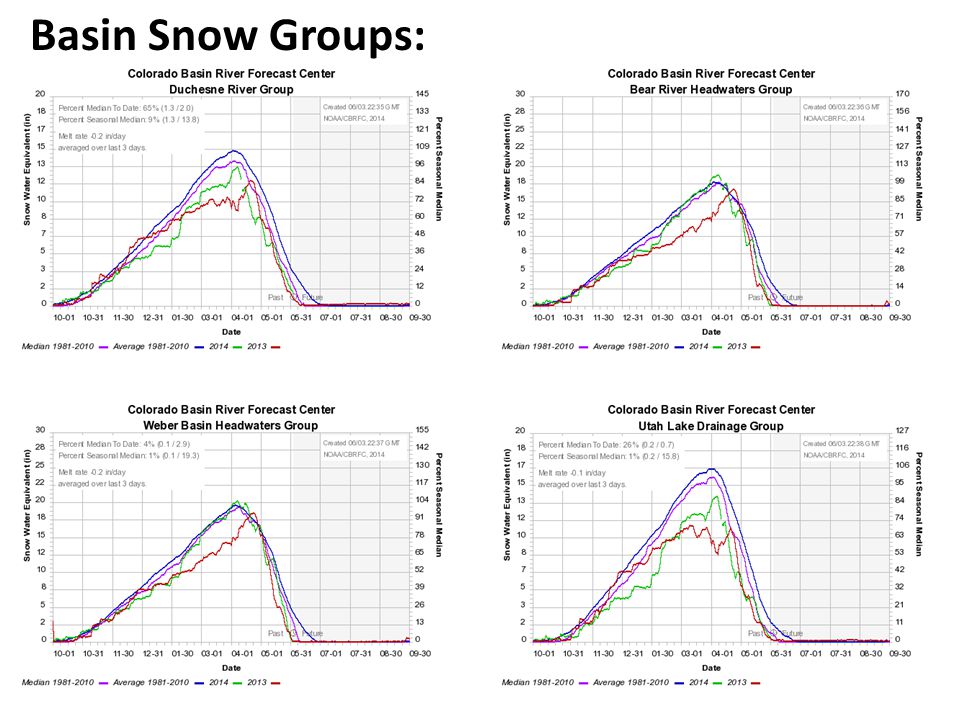
Basin Snow Groups:

13
April – May Observations Apr-May Volumes / % Average Lake Powell: 3050 KAF / 90% Flaming Gorge: 460 KAF / 121% Navajo Res: 300 KAF / 67% Blue Mesa: 370 KAF / 126% Colorado-Cameo: 1300 KAF / 138% Yampa-Deerlodge: 850 KAF / 115% Weber-Oakley: 50 KAF / 92% Virgin-Virgin: 10.9 KAF / 25% McPhee Res: 120 KAF / 61% Provo-Woodland: 57 KAF / 108%

14
April – July Forecasts Apr-July Volumes / % Average Lake Powell: 7550 KAF / 105% Flaming Gorge: 1320 KAF / 135% Navajo Res: 455 KAF / 62% Blue Mesa: 860 KAF / 128% Colorado-Cameo: 3140 KAF / 133% Yampa-Deerlodge: 1550 KAF / 125% Weber-Oakley: 92 KAF / 78% Virgin-Virgin: 19 KAF / 32% McPhee Res: 190 KAF / 64% Provo-Woodland: 95 KAF / 95%

15
10 % 50% 90% June 1 st Official Forecast Daily Ensemble Streamflow Prediction (ESP) Model Run & Official Forecast Available at: www.cbrfc.noaa.gov Select: Water Supply Click: Point of Interestwww.cbrfc.noaa.gov 7550 KAF/105% ESP will be a combination of forecast + observed to date
 Model Run & Official Forecast Available at: Select: Water Supply Click: Point of Interestwww.cbrfc.noaa.gov 7550 KAF/105% ESP will be a combination of forecast + observed to date")
16
Daily Ensemble Streamflow Prediction (ESP) Model Run & Official Forecast Available at: www.cbrfc.noaa.gov Select: Water Supply Click: Point of Interestwww.cbrfc.noaa.gov 1130 KAF/156 %
 Model Run & Official Forecast Available at: Select: Water Supply Click: Point of Interestwww.cbrfc.noaa.gov 1130 KAF/156 %")
17
Daily Ensemble Streamflow Prediction (ESP) Model Run & Official Forecast Available at: www.cbrfc.noaa.gov Select: Water Supply Click: Point of Interestwww.cbrfc.noaa.gov 1550 KAF/125 %
 Model Run & Official Forecast Available at: Select: Water Supply Click: Point of Interestwww.cbrfc.noaa.gov 1550 KAF/125 %")
18
Daily Ensemble Streamflow Prediction (ESP) Model Run & Official Forecast Available at: www.cbrfc.noaa.gov Select: Water Supply Click: Point of Interestwww.cbrfc.noaa.gov 3140 KAF/133%
 Model Run & Official Forecast Available at: Select: Water Supply Click: Point of Interestwww.cbrfc.noaa.gov 3140 KAF/133%")
19
Daily Ensemble Streamflow Prediction (ESP) Model Run & Official Forecast Available at: www.cbrfc.noaa.gov Select: Water Supply Click: Point of Interestwww.cbrfc.noaa.gov 118 KAF/119%
 Model Run & Official Forecast Available at: Select: Water Supply Click: Point of Interestwww.cbrfc.noaa.gov 118 KAF/119%")
20
Daily Ensemble Streamflow Prediction (ESP) Model Run & Official Forecast Available at: www.cbrfc.noaa.gov Select: Water Supply Click: Point of Interestwww.cbrfc.noaa.gov 860 KAF/127%
 Model Run & Official Forecast Available at: Select: Water Supply Click: Point of Interestwww.cbrfc.noaa.gov 860 KAF/127%")
21
Daily Ensemble Streamflow Prediction (ESP) Model Run & Official Forecast Available at: www.cbrfc.noaa.gov Select: Water Supply Click: Point of Interestwww.cbrfc.noaa.gov 455 KAF / 62%
 Model Run & Official Forecast Available at: Select: Water Supply Click: Point of Interestwww.cbrfc.noaa.gov 455 KAF / 62%")
22
Daily Ensemble Streamflow Prediction (ESP) Model Run & Official Forecast Available at: www.cbrfc.noaa.gov Select: Water Supply Click: Point of Interestwww.cbrfc.noaa.gov 92 KAF/ 78 %
 Model Run & Official Forecast Available at: Select: Water Supply Click: Point of Interestwww.cbrfc.noaa.gov 92 KAF/ 78 %")
23
April – July Rankings Projected Apr-Jul Volumes / Rank (1-Wettest) Colorado River at Kremmling: 1430 KAF/ 3 West Canyon Creek: 0.16 KAF/ 38 (driest) LambsCreek: 1.25 KAF/ 42 ( 3 rd driest) Much of the Colorado Headwaters region above Kremmling is in the top 5
 Colorado River at Kremmling: 1430 KAF/ 3 West Canyon Creek: 0.16 KAF/ 38 (driest) LambsCreek: 1.25 KAF/ 42 ( 3 rd driest) Much of the Colorado Headwaters region above Kremmling is in the top 5")
24
Quantitative Precipitation Forecast Weather Prediction Center June 4 – 11 www.hpc.ncep.noaa.gov

25
Maximum Temperature Anomaly: June 7 – 11

26
Long Term Precipitation Outlook Climate Prediction Center www.cpc.ncep.noaa.gov Jun 2014Jun – Aug 2014

27
El Niño conditions expected to develop by summer – Correlation is not particularly strong over the Upper Colorado River Basin – Correlation is with precipitation and temperatures, which is not always directly reflected in streamflows Climate in our region is influenced by other teleconnections http://www.climate.gov/news-features/department/8443/all Looking ahead

31
Peak Flows Many sites are peaking this time of year When sites are near peak do NOT check the peak flow page – Daily forecasts updated more frequently – More responsive to changes in regulation and weather conditions – Peak forecast page will not be updated again this year

33
Key Water Supply Contacts: – Michelle Stokes (michelle.stokes@noaa.gov) (Hydrologist in Charge)michelle.stokes@noaa.gov – Brenda Alcorn (brenda.alcorn@noaa.gov) (Upper Colorado)brenda.alcorn@noaa.gov – Ashley Nielson (ashley.nielson@noaa.gov) (Green + Yampa / White)ashley.nielson@noaa.gov – Greg Smith (greg.smith@noaa.gov) (San Juan + Gunnison + Dolores)greg.smith@noaa.gov – Paul Miller (paul.miller@noaa.gov) (Great Basin)paul.miller@noaa.gov – Tracy Cox (tracy.cox@noaa.gov) (Lower Colorado + Virgin + Sevier)tracy.cox@noaa.gov Please contact us with any specific questions

Similar presentations


 Review snow conditions and seasonal precipitation Comparison of daily flows along the Animas River >")


