Download presentation
Presentation is loading. Please wait.

1
Dayton and Southwest Ohio Economy Richard Stock, PhD. Business Research Group University of Dayton

2
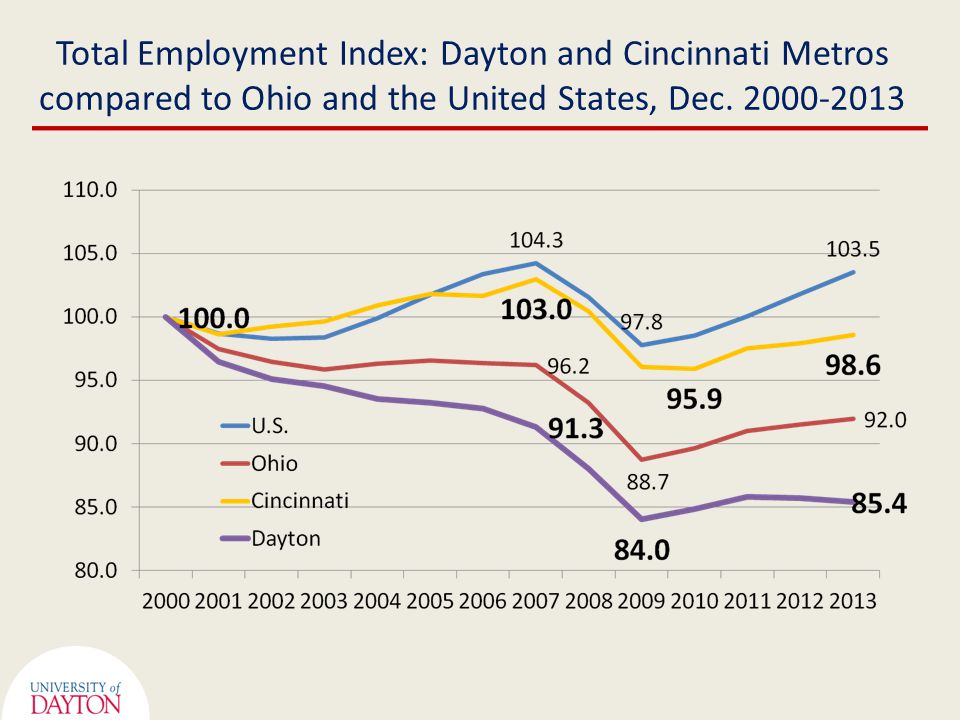
State of the Dayton Metro Area (in December Each Year, 2000-2013) Dayton lost 32,400 jobs in the two year period from December, 2007 to December, 2009. It recovered 7,900 of those jobs in the 2 years to December, 2011 That recovery has stagnated in the last two years

3
State of the Dayton Metro Area: Last 4 Years (in December Each Year, 2009-2013) Growth was steady in the Dec. 2009 to Dec. 2011 period. Last 24 months, loss of 1700 jobs

4
Total Employment Index: Dayton and Cincinnati Metros compared to Ohio and the United States, Dec. 2000-2013
5
Construction Employment Index: Ohio and the United States, Dec. 2000-2013

6
Manufacturing Employment Index: Dayton and Cincinnati Metros compared to Ohio and the U.S., Dec. 2000-2013

7
Trade, Transportation, Utilities Employment Index: Dayton and Cincinnati Metros compared to Ohio and the United States, December 2000-2013

8
Prof. & Bus. Serv. Employment Index: Dayton and Cincinnati Metros compared to Ohio and the United States, December 2000- 2013

9
Education and Health Services Index: Dayton & Cincinnati Metros compared to Ohio and the United States, December 2000-2013

10
Government Employment Index: Dayton & Cincinnati Metros compared to Ohio and the United States, December 2000-2013 Note that Government Employment Actually Rose in Dayton Metro from 2008 to 2010

11
Federal Government Employment Index: Dayton & Cincinnati Metros compared to Ohio and the United States, December 2000- 2013 Note that Government Employment Actually Rose in Dayton Metro from 2008 to 2010

12
Local Government Employment Index: Dayton & Cincinnati Metros compared to Ohio and the United States, December 2000-2013

13
The Income Piece How Big is the Wage Problem?

14
Average Weekly Earnings in Dayton and Cincinnati relative to Ohio and U.S., November 2007-2013 (2013 Constant Dollars)
")
15
Relationship to National Economy

16
Cyclical factors How closely linked is the Dayton Economy to the National Economy? From December, 2002 to December, 2013, 92% of variation in monthly Dayton Metro Area unemployment rate can be explained by variation in the U.S unemployment rate

17
United States, Dayton Metropolitan Area Monthly Unemployment Rates, December 2002-December 2013

18
United States, Dayton Metropolitan Area Monthly Unemployment Rates, December 2006-December 2013

19
United States, Dayton Metropolitan Area Monthly Single Housing Units Building Permits, August 2001-November 2013 (Aug 2001 =100)
")
20
Dayton Metropolitan Area Monthly Single Housing Units Building Permits, November 2002-November 2013

21
Number of Unemployed in Dayton Metropolitan Areas, 1990- November 2013

22
Forecasting the Next 3 years Note that the Dayton Metropolitan Areas has mirrored the Country as a whole more closely in the last few years. What are the implications of the National Economic Forecast? Federal Government and Local Employment Declines Have Already Taken a Toll. How Much More?

23
Survey of Professional Forecasters, Philadelphia Federal Reserve Bank (4 th Quarter Estimates) Unemployment Rate (%) CPI Inflation Rate (%) Real GDP (%) HeadlineCore Quarterly data: 2014:Q12.06.71.71.8 2014:Q23.06.61.71.8 2014:Q32.86.41.9 2014:Q42.76.32.01.9 2015:Q13.26.22.02.1 Annual average data: 2014 2.86.51.81.9 2015 3.16.12.0 2016 3.15.7 2.1 2017 2.45.5
 Unemployment Rate (%) CPI Inflation Rate (%) Real GDP (%) HeadlineCore Quarterly data: 2014:Q :Q :Q :Q :Q Annual average data:")
24
Implications of National Forecast for the Dayton Metropolitan Economy Unemployment Rate (%) Dayton Metro Real GDP (%) Unemployment Rate Number of Unemployed Quarterly data: 2014:Q12.06.76.927,500 2014:Q23.06.66.827,200 2014:Q32.86.46.626,600 2014:Q42.76.36.526,300 2015:Q13.26.2 Annual average data: 2014 2.86.56.726,600 2015 3.16.16.325,400 2016 3.15.7 5.923,800 2017 2.45.5 5.723,000
 Dayton Metro Real GDP (%) Unemployment Rate Number of Unemployed Quarterly data: 2014:Q , :Q , :Q , :Q , :Q Annual average data: , , , ,000")
25
Defense Budget Squeeze Impact Number of Jobs Linked to Wright Patterson Air Force Base Activities ~ 25,000 to 30,000 Cuts are likely to be program specific for particular big ticket items, impact on Wright Patterson related employment is uncertain. If one assumes a 10% drop in WPAFB related employment over a 3 to 4 year period, that implies 2500 to 3000 fewer jobs or an annual impact of about a 1000 jobs. It represents a head wind on local job growth One potential upside – potential wins in next BRAC rounds

26
Summary Job growth in the Dayton Metro Area economy has stalled in the last 24 months The Dayton Metro Area Unemployment rate remains closely linked to National levels but is lagging behind While the Dayton economy mirrors more closely the national economy in 2013 than at any point in the last 20 years, reductions in planned defense spending will constitute a headwind over the next few years.

Similar presentations
 = $11,814.9B (5.5%) Q2: GDP = $2,914.38.>")


 measures the dollar value of all goods and services produced in the U.S. economy in.>")


