Download presentation
Presentation is loading. Please wait.

1
Global warming is over: Geologic, oceanographic, and solar evidence for global cooling in the coming decades Global warming is over: Geologic, oceanographic, and solar evidence for global cooling in the coming decades Don J. Easterbrook Don J. Easterbrook

2
Glacier fluctuations, global climate change, and ocean temperature changes Glacier advances and retreats provide both long term and short term records of climate change. Glacier fluctuations match global climate changes. Ocean temperature changes match glacier oscillations and global climate changes

3
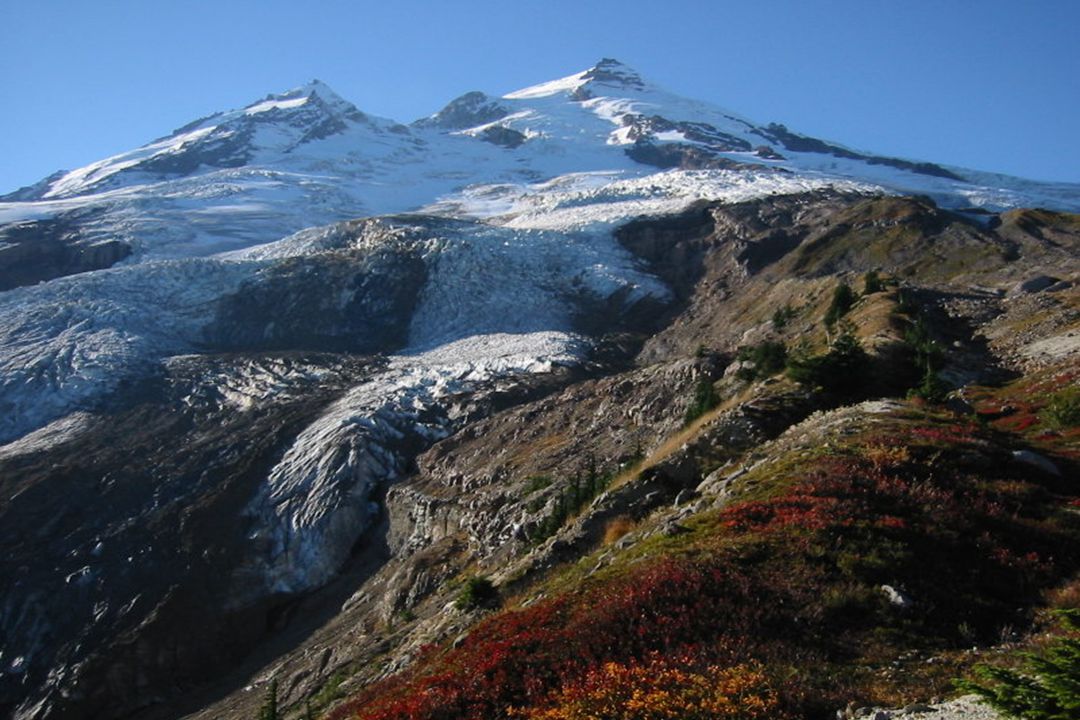
Glacier fluctuations on Mt. Baker, WA Little Ice Age global glacier advance disproves Mann ‘hockey stick’ claim

4
Little Ice Age glacial margin, Mt. Baker, WA

5
Fluctuating glacial margins, Little Ice Age (1600 AD to 1979)
")
7
Boulder Glacier, Mt. Baker 1940 to 1956 1956 to 1979

10
GLACIER FLUCTUATIONS CLIMATE CHANGES PDO-AMO MODE CHANGES WHAT DRIVES PDO-AMO MODES?

11
PDO COLD MODE (1945-77) PDO WARM MODE (1977-98
 PDO WARM MODE (")
13
PDO switch from cool mode to warm mode in 1977

14
Change from global cooling to global warming in 1977 (the Great Climate Shift) with no change in CO 2
 with no change in CO 2")
15
Greenland oxygen isotope record of warm and cool periods, 1480 to 1950 AD

16
Global climate changes correlate well with changes in: 1.Solar irradiance. 2. Numbers of sunspots and sunspot cycle length. 3. Production of 10 Be and 14 C in the atmosphere from radiation.

17
No correlation between CO 2 and global climate. Excellent correlation between solar variation and global climate

18
Solar cycle length and temperature

19
Solar irradiance and global temperature

20
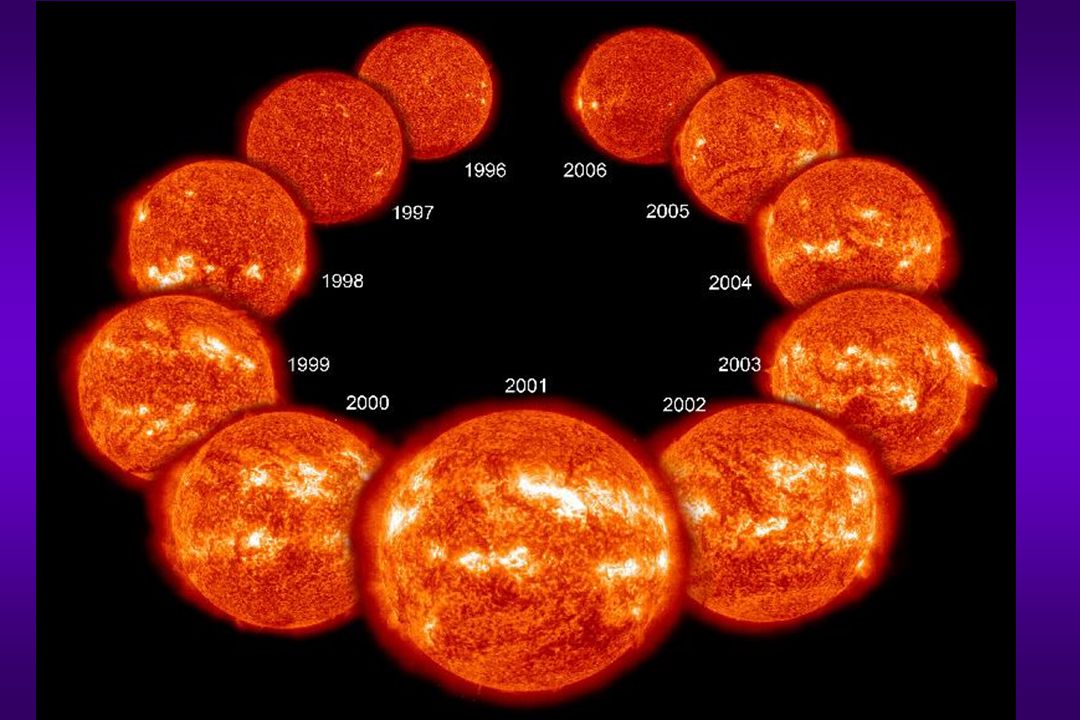
Sun spots

23
Sunspots, auroras, and 14 C production rates

25
Maunder Minimum

26
Virtually no sun spots occurred during the Little Ice Age

27
Global cooling occurs during times of few sunspots and low solar irradiance

28
Where are we headed during the coming century?

29
IPCC predicts 1°F increase in global temp by 2011 and up to 10 °F by 2100, but no warming since 1998 and 1°F cooling this year was the largest global temp change ever recorded

30
IPCC predicted 1°F warming per decade Global climate has cooled since 1998

31
IPCC Model Predictions vs Actual temp

32
2008 temperatures in the U.S.

33
THE CLIMATE IS COOLING, NOT WARMING

34
What happened to global warming? 46” of snow in two weeks in N.Y.

36
Setting up of the PDO cold phase assures global cooling for the next ~30 years.

37
Past and predicted PDO

38
Projected global temp to 2100

40
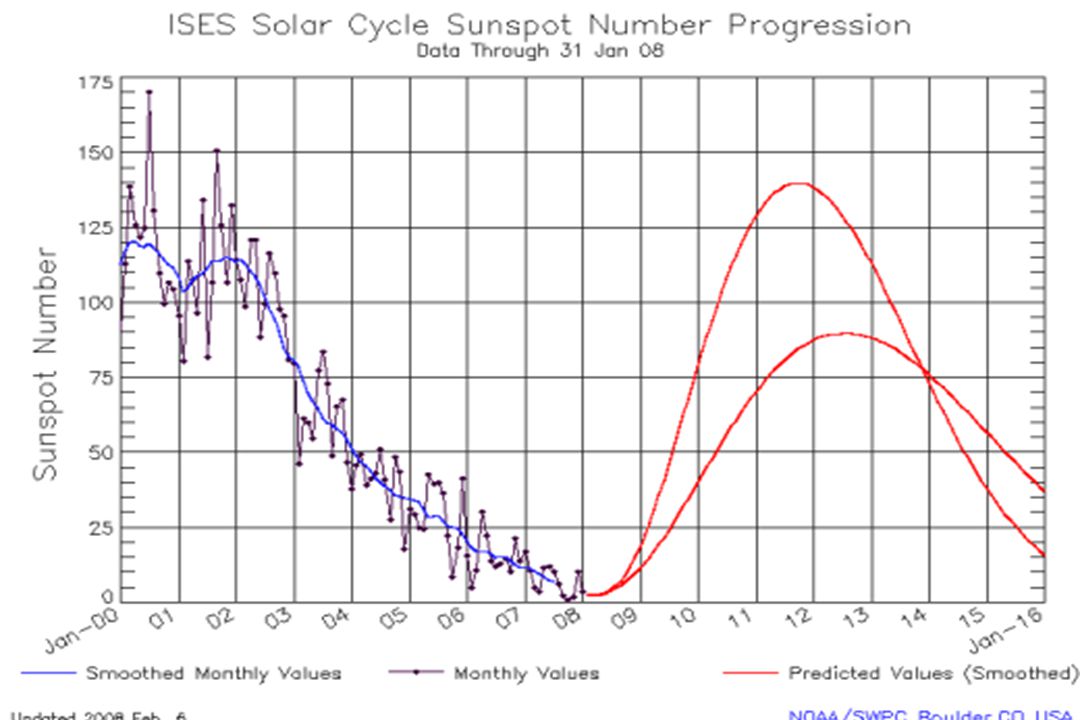
Cycle 24 prediction

41
Cycle 23/24 resembles the Dalton Minimum

42
Sun spot cycle 23 resembles cycle 4 which preceded the Dalton Minimum

43
Solar cycle 24 may be colder than the 1880-1915 cold period

44
Sun spot cycles of the Dalton Minimum

45
What does this global cooling mean? Minnesota, April, 2008 Continuation of ongoing 10-yr cooling trend and 500 yr climate pattern. Follows ocean SST patterns exactly. IPCC model predictions were badly wrong Shows that ‘global warming’ is over. CO 2 did not cause ‘global warming.’

46
Facts: No correlation between C0 2 and global warming in the past. 1. Half of the warming in the past century occurred before CO 2 began to rise sharply. 2. For 30 years after CO 2 began to soar, global cooling occurred, rather than warming. 3. Of the 25 past periods of global warming, only the last one (the past 30 years) corresponds to rising CO 2 96% of global warming periods in the past 500 years have no correlation with CO 2
 corresponds to rising CO 2 96% of global warming periods in the past 500 years have no correlation with CO 2.")
47
Computer simulations Blistering future is forecast One study projects that by 2100, temperatures of 117 in LA, Chicago, 115, Kansas City 116, Delhi 120, Baghdad 122, Belem Brazil 121, France 118. (AP) Computer models have predicted sharply rising global temp, but global cooling since 1998 has invalidated the models used for forecasting global climate change.
 Computer models have predicted sharply rising global temp, but global cooling since 1998 has invalidated the models used for forecasting global climate change..")
48
Evidence that ‘global warming’ is a continuation of natural climatic cycles The geologic record of past climate changes shows consistent patterns for the past 1000 years, all well before increased atmospheric CO 2. Temperature records in the Greenland ice core for the past 500 years show a 27-year cycle of alternating warm and cool periods. The warm period for the past 30 years exactly fits the pattern of climate changes for the past several centuries. During the past century, each period of global warming or cooling corresponds exactly to PDO switches

49
Implications Global warming is over—expect 30 years of global cooling, perhaps severe (2-5°F). Atmospheric CO 2 is not the cause of global warming. Reducing emissions is important, but spending trillions of dollars will not change global climate. Beginning this year, global cooling will cause crop failures and serious food shortages. Cooling will increase energy demands, especially in high latitude regions. Drought areas should experience some relief.

50
The Earth’s population (6 billion) will increase 50% (3 billion) by 2050. The doubling time for population is 38 yrs. Huge demands will be placed on natural resources (e.g., food, energy, oil, water) will be exacerbated by global cooling.
 will be exacerbated by global cooling..")
51
Dogma is an impediment to the free exercise of thought. It paralyses the intelligence. Conclusions based upon preconceived ideas are valueless. It is only the open mind that really thinks Patricia Wentworth, 1949, Latter End

Similar presentations


 Earth’s surface would be 60F cooler than today…no life.>")

 –The hotter they.>")
 1. Is it warming? --climate proxy info (recap) -- info from historical & instrumental records 2. What.>")

 1. Enhanced Greenhouse Effect 2. CO 2 sensitivity 3. Projected CO 2 emissions 4. Projected CO 2 atmosphere concentrations 5. What.>")


![Climate: What we know about it, How we know about it, and What we’re doing to it.]](/17/5339947/big_thumb.jpg "Climate: What we know about it, How we know about it, and What we’re doing to it.]>")


