Download presentation
Presentation is loading. Please wait.

1
PROJECT TO INTERCOMPARE REGIONAL CLIMATE SIMULATIONS Global Warming Eugene S. Takle, PhD, CCM Professor of Atmospheric Science Professor of Agricultural Meteorology Iowa State University Ames, Iowa 50011 gstakle@iastate.edu Iowa Soil and Water Conservation Society, 22 September 2006

2
Carbon Dioxide and Temperature

3
2006

4
Carbon Dioxide and Temperature 2006 2040

5
Carbon Dioxide and Temperature Stabilization at 550 ppm

6
Carbon Dioxide and Temperature “Business as Usual” (fossil intensive) 2100
 2100")
10
PROJECT TO INTERCOMPARE REGIONAL CLIMATE SIMULATIONS “Nobody believes that the US economy can still be petroleum based in 2050, yet there is no national plan” Mark Kushner, Dean Iowa State University College of Engineering President’s Council Meeting 13 January 2006

11
PROJECT TO INTERCOMPARE REGIONAL CLIMATE SIMULATIONS

13
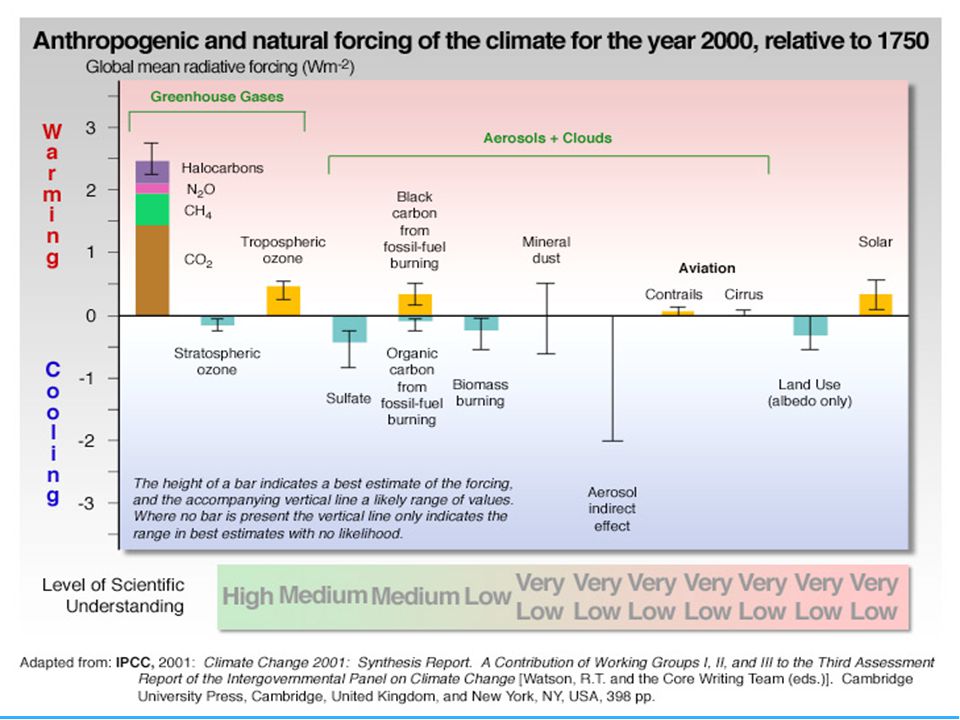
Contributions to “global dimming”

14
PROJECT TO INTERCOMPARE REGIONAL CLIMATE SIMULATIONS

16
Source: IPCC, 2001: Climate Change 2001: The Scientific Basis

19
PROJECT TO INTERCOMPARE REGIONAL CLIMATE SIMULATIONS Associated Climate Changes Global sea-level has increased 1-2 mm/yr Duration of ice cover of rivers and lakes decreased by 2 weeks in N. Hemisphere Arctic ice has thinned substantially, decreased in extent by 10-15% Reduced permafrost in polar, sub-polar, mountainous regions Growing season lengthened by 1-4 days in N. Hemisphere Retreat of continental glaciers on all continents Poleward shift of animal and plant ranges Snow cover decreased by 10% Earlier flowering dates Coral reef bleaching Source: Intergovernmental Panel on Climate Change, 2001 Report

20
Since 1979, the size of the summer polar ice cap has shrunk more than 20 percent. (Illustration from NASA) ( http://www.nrdc.org/globalWarming/qthinice.asp)
 (")
21
Emanual, Kerry, 2005: Increasing destructiveness of tropical cyclones over the past 30 years. Nature, 436, 686-688. Sea-surface temperature VV Tropical Atlantic Ocean Hurricane Power Dissipation Index (PDI) V
 V.")
22
Emanual, Kerry, 2005: Increasing destructiveness of tropical cyclones over the past 30 years. Nature, 436, 686-688. Sea-surface temperature VV Tropical Atlantic Ocean Hurricane Power Dissipation Index (PDI) V
 V.")
23
PROJECT TO INTERCOMPARE REGIONAL CLIMATE SIMULATIONS

24
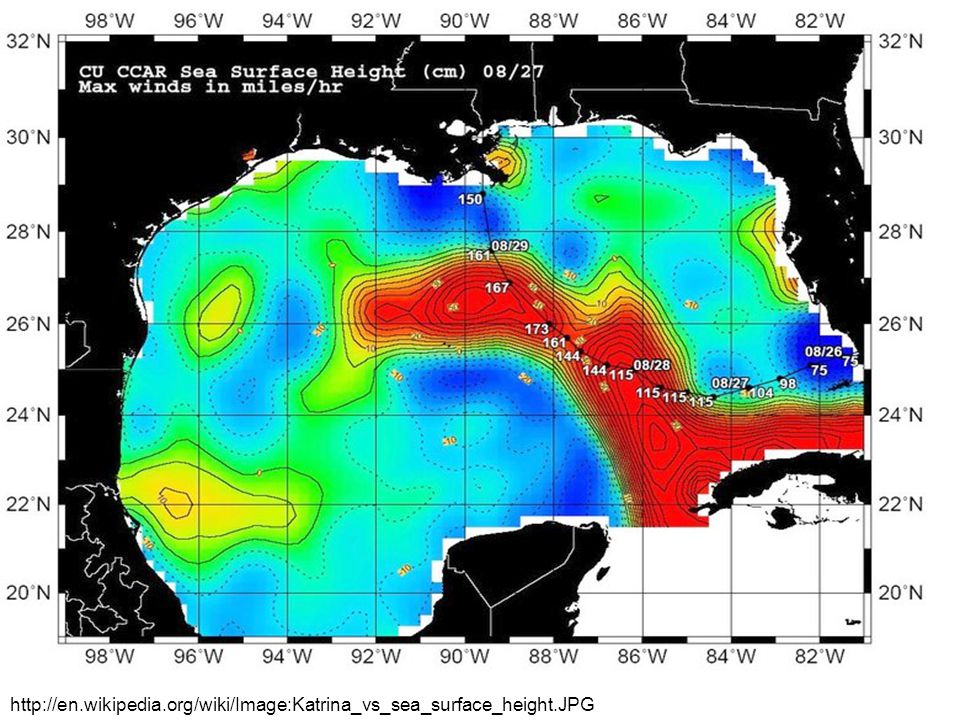
Tropical Weather Weather Underground: http://www.wunderground.com/tropical/

25
http://en.wikipedia.org/wiki/Image:Katrina_vs_sea_surface_height.JPG
26
Source: Jerry Meehl, National Center for Atmospheric Research

27
Source: National Center for Atmospheric Research

28
The planet is committed to a warming over the next 50 years regardless of political decisions

29
Source: National Center for Atmospheric Research The planet is committed to a warming over the next 50 years regardless of political decisions Adaptation Necessary Mitigation Possible

30
Source: Intergovernmental Panel on Climate Change, 2001 Report

31
40% Probability 5% Probability Source: Intergovernmental Panel on Climate Change, 2001 Report

32
Source: Corell, R. W., 2004: Impacts of a warming Arctic. Arctic Climate Impact Assessment (www.acia.uaf.edu) Cambridge University Press (www.cambridge.org).www.acia.uaf.edu

33
PROJECT TO INTERCOMPARE REGIONAL CLIMATE SIMULATIONS Jakobshavn Ice Stream in Greenland Discharge from major Greenland ice streams is accelerating markedly. Source: Prof. Konrad Steffen, Univ. of Colorado

34
140-page synthesis report released in November 2004. Main science report imminent (chapters available electronically at www.acia.uaf.edu).www.acia.uaf.edu Concerns over wide-ranging changes in the Arctic. –Rising temperatures –Rising river flows –Declining snow cover –Increasing precipitation –Thawing permafrost –Diminishing late and river ice –Melting glaciers –Melting Greenland Ice Sheet –Retreating summer sea ice –Rising sea level –Ocean salinity changes Species at risk include polar bears, seals, walruses, Arctic fox, snowy owl, and many species of mosses and lichens Arctic Climate Impact Assessment (ACIA) Sources: Claire Parkinson and Robert Taylor
 Sources: Claire Parkinson and Robert Taylor.")
35
Increasing Melt Area on Greenland 2002 all-time record melt area Melting up to elevation of 2000 m 16% increase from 1979 to 2002 70 meters thinning in 5 years Satellite-era record melt of 2002 was exceeded in 2005. Source: Waleed Abdalati, Goddard Space Flight Center

36
PROJECT TO INTERCOMPARE REGIONAL CLIMATE SIMULATIONS Scientific Consensus of Five Years Ago Likely Underestimated Rate of Climate Change* Global dimming has decreased Permafrost melting is widespread Biomass feedbacks are kicking in Arctic sea ice is retreating rapidly Poleward movement of mid-latitude westerlies; strengthening of ocean gyres Rapid Greenland and Antarctic ice-shelf disintegration Increased intensity of tropical cyclones Accelerated changes in North Atlantic ocean thermohaline circulation * Pittock, A. B., 2006: Are scientist underestimating climate change? EOS, 87, 340.

37
For the Midwest Warming will be greater for winter than summer Warming will be greater at night than during the day A 3 o F rise in summer daytime temperature triples the probability of a heat wave Growing season will be longer (8-9 days longer now than in 1950) More precipitation Likely more soil moisture in summer More rain will come in intense rainfall events Higher stream flow, more flooding
 More precipitation Likely more soil moisture in summer More rain will come in intense rainfall events Higher stream flow, more flooding")
38
PROJECT TO INTERCOMPARE REGIONAL CLIMATE SIMULATIONS Climate Surprises Breakdown of the ocean thermohaline circulation (Greenland melt water) Break-off of the West Antarctic Ice Sheet
 Break-off of the West Antarctic Ice Sheet")
41
PROJECT TO INTERCOMPARE REGIONAL CLIMATE SIMULATIONS Areas subjected to Inundation with a 1 m (~3 ft) rise in sea level Kennedy Space Center Miami
 rise in sea level Kennedy Space Center Miami")
42
PROJECT TO INTERCOMPARE REGIONAL CLIMATE SIMULATIONS What Constitutes “Dangerous Anthropogenic Interference with the Climate System”? James Hansen, Director of the NASA Goddard Institute for Space Studies: *Radiative forcing limit: 1 Watt/ m 2 *1 o C additional rise in global mean temperature

43
Hansen, Scientific American, March 2004 Mt. Pinatubo (1991) El Chichon (1982) Agung, 1963
 El Chichon (1982) Agung, 1963")
44
Hansen, Scientific American, March 2004 Mt. Pinatubo (1991) El Chichon (1982) Agung, 1963 Imbalance = 1 Watt/m 2 in 2018
 El Chichon (1982) Agung, 1963 Imbalance = 1 Watt/m 2 in")
45
PROJECT TO INTERCOMPARE REGIONAL CLIMATE SIMULATIONS Hansen, Scientific American, March 2004

46
Areas subjected to Inundation with a 1 m (~3 ft) rise in sea level Kennedy Space Center Miami Impact of a 1-m rise in sea level on low-lying areas Source: Corell, R. W., 2004: Impacts of a warming Arctic. Arctic Climate Impact Assessment (www.acia.uaf.edu) Cambridge University Press (www.cambridge.org).www.acia.uaf.edu Projected sea-level rise In 21st century: 0.5 to 1.0 m

47
PROJECT TO INTERCOMPARE REGIONAL CLIMATE SIMULATIONS “Another ice age cannot occur unless humans become extinct. Even then, it would require thousands of years. Humans now control global climate, for better or for worse.” James E. Hansen, Director NASA Goddard Institute for Space Studies New York City

48
Climate Model Resolution global regional (land) regional (water) Only every second RCM grid point is shown in each direction
 regional (water) Only every second RCM grid point is shown in each direction")
49
PROJECT TO INTERCOMPARE REGIONAL CLIMATE SIMULATIONS Summary Climate change is real and we need to be doing something about it to prevent “dangerous anthropogenic interference with the climate system” Mitigation will have no effect for 50 years, so we need to develop adaptation strategies for the short term The longer we wait, the fewer our options Regional patterns of warming will be complicated Climate surprises can’t be discounted We need dialog between scientists and the private sector to develop both adaptation and mitigation strategies

50
PROJECT TO INTERCOMPARE REGIONAL CLIMATE SIMULATIONS For More Information For peer-reviewed evidence supporting everything you have seen in this presentation, see my online Global Change course: http://www.meteor.iastate.edu/gccourse Contact me directly: gstakle@iastate.edu

Similar presentations


![Climate Change Impacts in the United States Third National Climate Assessment [Name] [Date] Climate Trends.](/15/4626683/big_thumb.jpg "Climate Change Impacts in the United States Third National Climate Assessment [Name] [Date] Climate Trends.>")


 to +4.0°C.>")
. Global Warming Global Warming – is the increase of Earth’s average surface temperature due to effect of greenhouse.>")

