Download presentation
Presentation is loading. Please wait.

1
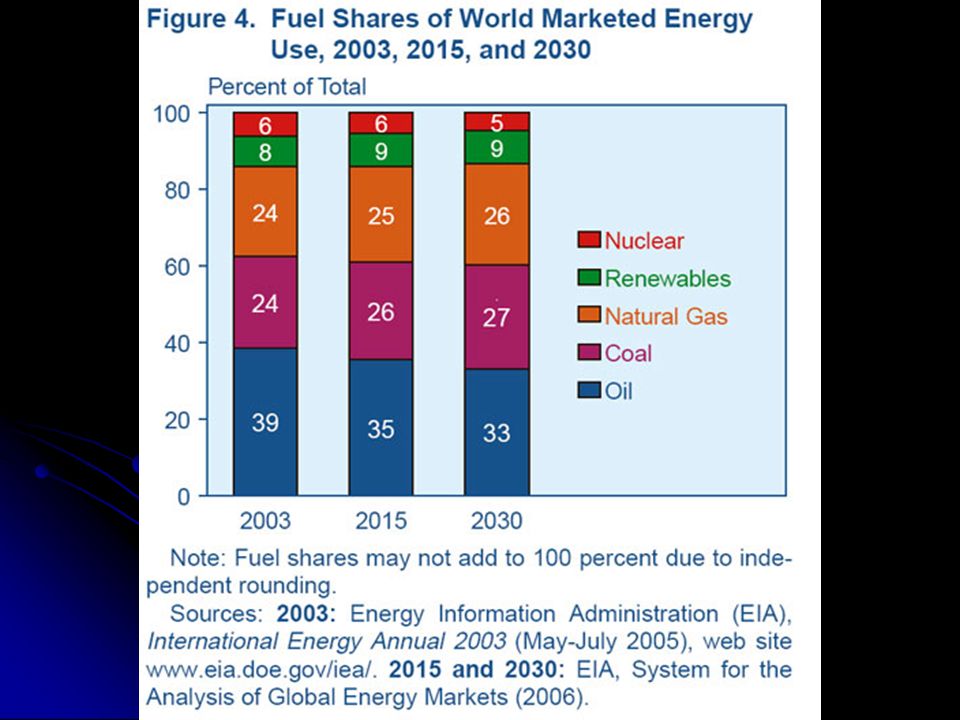
Energy World energy consumption projected to rise > 70% from 2003 to 2030 OECD

2
Energy Bulk of increase expected to come from non-OECD nations Energy demand in Asia, Central and South America expected to more than double by 2030

3
Energy A. A.Conventional 1. 1.Fossil Fuels a. a.Oil Transportation, electricity generation, heating World’s dominant source of energy for past several decades Expected to remain important for next 20 years - Estimated ~35-40% of total energy consumption through 2020 Greatest consumption by OECD nations, but gap closing 1999 – Non-OECD nations consumed 58% as much as OECD nations 2030 – Projected to use ~90% as much Most of increase from transportation sector (few alternative fuel sources)
.")
4
Energy A. A.Conventional 1. 1.Fossil Fuels a. a.Oil Benefits Readily available High energy density Inexpensive Existing technology & infrastructure Concerns Combustion releases pollutants (CO 2, NOx, SOx, PM) Extraction harms environment Accidental releases, especially in ocean Long-term availability Energy security - US imports 60% of oil
 Extraction harms environment Accidental releases, especially in ocean Long-term availability Energy security - US imports 60% of oil.")
5
Energy A. A.Conventional 1. 1.Fossil Fuels b. b.Coal Electricity generation (65% of global coal use) Main fuel source in China for industry Use expected to grow slowly, mostly fueled by Asia, especially China and India Benefits Inexpensive Abundant, easy to recover Requires minimal processing Existing technology & infrastructure Concerns Environmental degradation from mining Requires extensive transportation system (rail) Combustion generates pollutants (CO 2, PM, Hg, NOx, SOx), including components of brown smog
 Main fuel source in China for industry Use expected to grow slowly, mostly fueled by Asia, especially China and India Benefits Inexpensive Abundant, easy to recover Requires minimal processing Existing technology & infrastructure Concerns Environmental degradation from mining Requires extensive transportation system (rail) Combustion generates pollutants (CO 2, PM, Hg, NOx, SOx), including components of brown smog.")
6
Energy A. A.Conventional 1. 1.Fossil Fuels c. c.Natural gas (methane) Fastest growing source of energy over next 20 years (projected to double) Equaled coal (BTU basis) in 1999 Increase fueled by price, environmental concerns, energy security issues, market deregulation Benefits Inexpensive Abundant, easy to recover Existing technology & infrastructure Burns relatively cleanly (little PM, etc.), almost no solid waste High efficiency (90% vs. 27% for electricity) Energy security – US produces 85% of demand vs. 40% for oil Concerns Greenhouse gas Adequate long-term supply
 Fastest growing source of energy over next 20 years (projected to double) Equaled coal (BTU basis) in 1999 Increase fueled by price, environmental concerns, energy security issues, market deregulation Benefits Inexpensive Abundant, easy to recover Existing technology & infrastructure Burns relatively cleanly (little PM, etc.), almost no solid waste High efficiency (90% vs. 27% for electricity) Energy security – US produces 85% of demand vs. 40% for oil Concerns Greenhouse gas Adequate long-term supply.")
7
Energy A. A.Conventional 1. 1.Fossil Fuels d. d.Gas (methane) hydrates Worldwide reserves estimated at up to 100,000 trillion cubic feet of gas (10,000 Gt carbon), twice the carbon in all other fossil fuel reserves on earth Located beneath marine sediments at 300-500 m depth Common off SE US, Siberia, Alaska Benefits Extremely abundant Existing infrastructure for distribution Burns relatively cleanly (little PM, etc.), almost no solid waste High efficiency (90% vs. 27% for electricity) Energy security – US has extensive reserves Concerns Greenhouse gas Damage to sea floor Catastrophic effects of massive release
 hydrates Worldwide reserves estimated at up to 100,000 trillion cubic feet of gas (10,000 Gt carbon), twice the carbon in all other fossil fuel reserves on earth Located beneath marine sediments at m depth Common off SE US, Siberia, Alaska Benefits Extremely abundant Existing infrastructure for distribution Burns relatively cleanly (little PM, etc.), almost no solid waste High efficiency (90% vs. 27% for electricity) Energy security – US has extensive reserves Concerns Greenhouse gas Damage to sea floor Catastrophic effects of massive release.")
8
Energy A. A.Conventional 2. 2.Nuclear Derived from splitting ("fissioning“) of uranium atoms Uranium mined, processed to increase fissionable material, made into fuel rods Uranium atoms split inside reactor, generate heat steam electricity World capacity projected to rise from 362 GW in 2003 to 437 GW in 2030 Highest growth projected for developing world, especially Asia Benefits Clean (few pollutants or GHGs) Relatively inexpensive Existing technology & infrastructure Compact fuel & waste (high energy density – 1 lb of U = 3.5 million lbs of coal) Energy security – US has extensive reserves Concerns Safety – Possibility of accidents Strategic risks – Material stolen and used to create weapon Waste disposal – Contamination of ground water, soil, animals, plants, people GHG production from mining & transportation of uranium
 of uranium atoms Uranium mined, processed to increase fissionable material, made into fuel rods Uranium atoms split inside reactor, generate heat steam electricity World capacity projected to rise from 362 GW in 2003 to 437 GW in 2030 Highest growth projected for developing world, especially Asia Benefits Clean (few pollutants or GHGs) Relatively inexpensive Existing technology & infrastructure Compact fuel & waste (high energy density – 1 lb of U = 3.5 million lbs of coal) Energy security – US has extensive reserves Concerns Safety – Possibility of accidents Strategic risks – Material stolen and used to create weapon Waste disposal – Contamination of ground water, soil, animals, plants, people GHG production from mining & transportation of uranium.")
11
Energy B. B.Renewable Sources either can’t be used up or are replenished quickly through natural processes In CA, eligible renewable energy sources include 1) 1)Biomass and waste 2) 2)Geothermal 3) 3)Solar 4) 4)Small hydroelectric 5) 5)Wind energy Use expected to increase by 65% worldwide between 2003 and 2030; current 8% share of total energy consumption projected to rise slightly to 9% by 2030 Growth in renewable energy resources expected to be constrained by moderate fossil fuel prices Energy consumption expected to be driven by new, large-scale hydroelectric projects, esp. in China, India, Malaysia, other developing Asian countries
 1)Biomass and waste 2) 2)Geothermal 3) 3)Solar 4) 4)Small hydroelectric 5) 5)Wind energy Use expected to increase by 65% worldwide between 2003 and 2030; current 8% share of total energy consumption projected to rise slightly to 9% by 2030 Growth in renewable energy resources expected to be constrained by moderate fossil fuel prices Energy consumption expected to be driven by new, large-scale hydroelectric projects, esp. in China, India, Malaysia, other developing Asian countries.")
12
Energy B. B.Renewable 1. 1.Hydroelectric Currently supplies ~20% of electricity production worldwide a. a.Small (<30 MW) Less impact but less power than large facilities b. b.Large (>30 MW) Includes immense dams with potentially large impacts Ex – Itaipu Dam (Brazil, Paraguay, Argentina) = 12,600 MW Ex – Three Gorges Dam (China) = 18,200 MW Benefits Inexpensive, once facility exists Minimal environmental impact – Little pollution, no GHGs Many facilities already in place May permit flood control Relatively efficient and nondestructive Concerns Limited use geographically Environmental degradation in flooded areas Environmental degradation downstream Detrimental to some aquatic animals (Ex – salmon) Collapses can be catastrophic Rainfall variation can reduce reliability
 Less impact but less power than large facilities b. b.Large (>30 MW) Includes immense dams with potentially large impacts Ex – Itaipu Dam (Brazil, Paraguay, Argentina) = 12,600 MW Ex – Three Gorges Dam (China) = 18,200 MW Benefits Inexpensive, once facility exists Minimal environmental impact – Little pollution, no GHGs Many facilities already in place May permit flood control Relatively efficient and nondestructive Concerns Limited use geographically Environmental degradation in flooded areas Environmental degradation downstream Detrimental to some aquatic animals (Ex – salmon) Collapses can be catastrophic Rainfall variation can reduce reliability.")
13
http://www.nwd-wc.usace.army.mil/report/colmap.htm

14
Energy B. B.Renewable 2. 2.Wind Power captured with wind turbines The Dakotas and Texas have sufficient wind capacity to supply energy needs of entire United States Benefits “Free” Minimal environmental impact – Little pollution, no GHGs Can produce electricity without being connected to power grid Multiple uses of land Concerns Limited use geographically Inconsistent energy source Expensive to maintain May be dangerous to birds Low power density Weather effects?

15
Energy B. B.Renewable 3. 3.Solar Can be generated by a. a.Focusing heat of sun on central point that heats up; heat used to produce steam, which turns turbine b. b.Photovoltaic (PV) cells – Convert energy from sun directly to electricity; each PV panel typically produces small amount of electricity, but panels can be grouped Benefits Abundant – “The amount of solar radiation striking the earth over a three-day period is equivalent to the energy stored in all fossil energy sources.” “Free” Minimal environmental impact – Little pollution, no GHGs PV systems have no moving parts, require little maintenance Can produce electricity without being connected to power grid Concerns Limited use geographically Inconsistent energy source Expensive – $0.22-0.40/kWh vs. $0.13/kWh on my latest bill Requires special materials to harvest energy Low power density; long-term storage of energy
 cells – Convert energy from sun directly to electricity; each PV panel typically produces small amount of electricity, but panels can be grouped Benefits Abundant – The amount of solar radiation striking the earth over a three-day period is equivalent to the energy stored in all fossil energy sources. Free Minimal environmental impact – Little pollution, no GHGs PV systems have no moving parts, require little maintenance Can produce electricity without being connected to power grid Concerns Limited use geographically Inconsistent energy source Expensive – $ /kWh vs. $0.13/kWh on my latest bill Requires special materials to harvest energy Low power density; long-term storage of energy.")
16
Energy B. B.Renewable 4. 4.Biomass and Waste Biomass fuels include residues from logging; mill operations; processing of wood, pulp, paper, fiberboard; agricultural crops; livestock and poultry operations; food processing; demolition (urban wood waste) Waste fuels include combustible residues from industrial processes, municipal solid & liquid wastes Currently supplies ~15% of electricity production worldwide, more in developing countries Benefits Readily available fuel Inexpensive Reduces waste stream Concerns Emissions – Especially for waste combustion Low fuel density Technology not yet well developed
 Waste fuels include combustible residues from industrial processes, municipal solid & liquid wastes Currently supplies ~15% of electricity production worldwide, more in developing countries Benefits Readily available fuel Inexpensive Reduces waste stream Concerns Emissions – Especially for waste combustion Low fuel density Technology not yet well developed.")
17
Energy B. B.Renewable 5. 5.Geothermal Heat from deep within earth captured and used to turn an electric generation turbine Benefits Inexpensive Minimal environmental impact – Little pollution, no GHGs Energy security – US has extensive resources Concerns Limited use geographically Not truly renewable (water injection can prolong life of geyser field) Geothermal emissions may include CO 2 and H 2 S, as well as various toxic compounds Not economically viable in most areas
 Geothermal emissions may include CO 2 and H 2 S, as well as various toxic compounds Not economically viable in most areas.")
18
Energy B. B.Renewable 6. 6.Fuel Cells Many types All have membrane that only allows positively charged particles to cross and external shunt that channels electrons Have been used for decades (powered manned space flights) Benefits Low emissions Highly efficient (up to 85% in some cases) No moving parts – Enhances durability, simplifies maintenance Energy security – Can be produced anywhere Concerns Technology still in its infancy Energy input during processing Risks of handling hydrogen and other fuels Currently very expensive
 Benefits Low emissions Highly efficient (up to 85% in some cases) No moving parts – Enhances durability, simplifies maintenance Energy security – Can be produced anywhere Concerns Technology still in its infancy Energy input during processing Risks of handling hydrogen and other fuels Currently very expensive.")
19
Energy B. B.Renewable 7. 7.Other Tidal energy Wave energy OTEC (Ocean Thermal Energy Conversion) Fusion
 Fusion.")
20
Energy California Net System Power Mix

21
Fresh Water Historically limiting factor in arid regions 1940-1990 World population more than doubled 2.3 billion 5.3 billion Per capita water use doubled 400 m 3 person -1 year -1 800 m 3 person -1 year -1 Global water use increased fourfold A. A.Current Status In 1996, world human population using estimated 54% of all accessible fresh water in rivers, lakes, aquifers Many people predict disastrous consequences for world’s fresh water supply in coming years This potential disaster may have several causes

22
Fresh Water A. A.Current Status 1. 1.Distribution Uneven compared to population 75% of annual rainfall in areas containing less than one-third of global population Amazon River carries 20% of global runoff through area containing 10 million people Congo River carries 30% of Africa’s runoff through area containing 10% of population Uneven in space North America contains 19,000 m 3 per person per year vs. 4700 m 3 per person per year in Asia 50% of annual runoff Uneven in time India gets 90% of annual rainfall during summer monsoon season (Jun-Sep); runs off too rapidly for efficient use
; runs off too rapidly for efficient use.")
23
Fresh Water A. A.Current Status 2. 2.Usage patterns Agriculture – 69% Industry/Energy – 23% Domestic – 8% Varies among regions and with development Africa – 88% for agriculture (irrigation) Europe – >50% for industry Japan – Industrial but uses lots of water for growing rice Spain/Portugal – Arid; water used heavily for agriculture Personal use tracks standard of living Africa – 17 m 3 year -1 (47 l d -1 ) Asia – 31 m 3 year -1 (85 l d -1 ) UK – 122 m 3 year -1 (334 l d -1 ) US – 211 m 3 year -1 (578 l d -1 ) By 2020, water shortages likely in Ethiopia, India, Kenya, Nigeria, China (parts of China already face problems) Mexico City uses groundwater for 80% of municipal water supply Depletion exceeds aquifer recharge rate by 50-80% Sinking of land in some areas Damage to buildings City imports water to meet demand
 Europe – >50% for industry Japan – Industrial but uses lots of water for growing rice Spain/Portugal – Arid; water used heavily for agriculture Personal use tracks standard of living Africa – 17 m 3 year -1 (47 l d -1 ) Asia – 31 m 3 year -1 (85 l d -1 ) UK – 122 m 3 year -1 (334 l d -1 ) US – 211 m 3 year -1 (578 l d -1 ) By 2020, water shortages likely in Ethiopia, India, Kenya, Nigeria, China (parts of China already face problems) Mexico City uses groundwater for 80% of municipal water supply Depletion exceeds aquifer recharge rate by 50-80% Sinking of land in some areas Damage to buildings City imports water to meet demand.")
24
Fresh Water A. A.Current Status 3. 3.Contamination Numerous examples worldwide Biggest source = Agriculture Europe – Over 90% of rivers have elevated nutrient levels from agrochemicals Hungary – Nearly 40% of well fields contaminated Developing countries – On average, 90% to 95% of all domestic sewage and 75% of all industrial waste discharged into surface waters without treatment 4. 4.Impacts Nile River – Diverting water + retention of sediment behind dams has caused fertile delta to shrink Rhine River – Lost 8 of 44 fish species; 25 more endangered Lake Chad – Diversion + drought has caused shrinkage from 25,000 to 2,000 km 2 in 30 years LinkLink Aral Sea – Diversion for agriculture has caused severe shrinkage, with environmental & health problems L1 L2L1L2

25
Fresh Water B. B.Possible Solutions World may have enough fresh water but inadequate distribution mechanism Long pipelines and movement of icebergs have been proposed Excessively expensive Technological limitations

26
Fresh Water B. B.Possible Solutions 1. 1.Improved irrigation efficiency Drip irrigation reduces losses from evaporation Cuts water use by 40-60% compared to conventional systems Used on <1% of irrigated land worldwide but used extensively in some countries (Ex – Israel uses DI on 50% of irrigated land) Low-energy precision application (LEPA) methods apply water directly to plants Can lower use of water and energy (20-50%) 2. 2.Municipal conservation Infrastructural losses can be substantial Ex – 40-70% of water lost in transit in 15 major Mexican cities (similar rates in India) Ex – Djakarta, Indonesia could cut water losses an estimated 20% by fixing leaky distribution pipes; would save ~12 billion gallons of water a year, enough to supply 800,000 people Higher price could encourage conservation Ex – Bogor, Indonesia increased water prices 3-4x; average household water use dropped by 30% in less than one year
 Low-energy precision application (LEPA) methods apply water directly to plants Can lower use of water and energy (20-50%) 2. 2.Municipal conservation Infrastructural losses can be substantial Ex – 40-70% of water lost in transit in 15 major Mexican cities (similar rates in India) Ex – Djakarta, Indonesia could cut water losses an estimated 20% by fixing leaky distribution pipes; would save ~12 billion gallons of water a year, enough to supply 800,000 people Higher price could encourage conservation Ex – Bogor, Indonesia increased water prices 3-4x; average household water use dropped by 30% in less than one year.")
27
Fresh Water B. B.Possible Solutions 3. 3.Reuse of urban wastewater Use of treated wastewater for irrigation Today, at least half a million hectares in 15 countries are being irrigated with “gray water” 4. 4.More water efficient industry Practiced in industrialized nations. Amount of water needed to produce a ton of steel ranges from 23 to 56 m 3 in China, compared to an average of less than 6 m 3 in US, Japan, and Germany 5. 5.Desalination 1990 – Just over 13 million m 3 of fresh water produced daily in 7,500 facilities worldwide Provides 0.1% of global fresh water use Current methods of desalination driven almost entirely by combustion of fossil fuels Solar powered desalination plants are currently produce only 5,240 cubic m 3 d -1

Similar presentations


 Anaerobic – Decomposition.>")
 Main fuel source in China for industry.>")


 o Coal: Is burned to produce heat o Nuclear Fission.>")
 Production – Use the sun’s energy to heat water or air Either stored or used immediately – Photovoltaic cells are used.>")


 Works from PHOTOVOLTAIC devices (PV)>")
