Download presentation
Presentation is loading. Please wait.

1
Image courtesy of NASA/GSFC

2
Assessment of Potential Impacts of Climate Changes on Iowa Using Current Trends and Future Projections Eugene S. Takle Director, Climate Science Initiative Professor of Atmospheric Science Department of Geological and Atmospheric Sciences Professor of Agricultural Meteorology Department of Agronomy Iowa State University Ames, Iowa 50011 gstakle@iastate.edu Eugene S. Takle Director, Climate Science Initiative Professor of Atmospheric Science Department of Geological and Atmospheric Sciences Professor of Agricultural Meteorology Department of Agronomy Iowa State University Ames, Iowa 50011 gstakle@iastate.edu House of Representatives Environmental Protection Committee Iowa Legislature Des Moines 13 January 2010

3
Outline Quick overview of global climate changes Examples of recent climate change in Iowa Assessment of future climate change for Iowa Impacts of climate change for Iowa Quick overview of global climate changes Examples of recent climate change in Iowa Assessment of future climate change for Iowa Impacts of climate change for Iowa

4
http://www.ncdc.noaa.gov/img/climate/research/2008/ann/global-jan-dec-error-bar-pg.gif Global Mean Surface Temperature IIIIIIIV

6
December- January- February Temperature Change A1B Emission Scenario 2080-2099 minus1980-1999 4.0 3.5

8
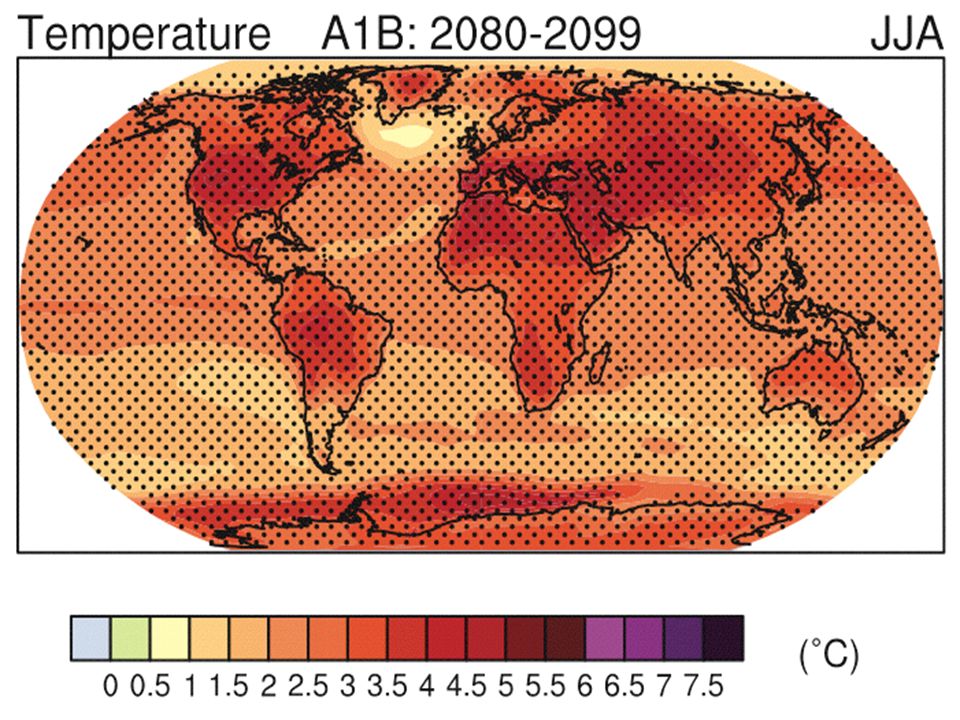
June-July- August Temperature Change A1B Emission Scenario 2080-2099 minus1980-1999 2.5 3.0

9
Source: IPCC 4 th Assessment Report, 2007

10
December- January- February Precipitation Change A1B Emission Scenario 2080-2099 minus1980-1999 0.0 0.1

11
Source: IPCC 4 th Assessment Report, 2007

12
June-July- August Precipitation Change A1B Emission Scenario 2080-2099 minus1980-1999 -0.1 0.0

13
Adapted from Folland et al. [2001] Observed Summer (JJA) Daily Maximum Temperature Changes (K), 1976-2000
 Daily Maximum Temperature Changes (K),")
14
Des Moines Airport Data 1983: 13 1988: 10 2009: 0

15
Des Moines Airport Data 1983: 13 1988: 10 2009: 0 6 days ≥ 100 o F in the last 20 years

16
Des Moines Airport Data 2009 2010

17
Des Moines Airport Data 2009 2010 Average 1976-2005: 3.2 days/yr

18
Des Moines Airport Data 2009 2010 Average 1976-2005: 3.2 days/yr Caution: Not adjusted for possible urban influence

19
Ames Data

20
Ave 1971-2000

21
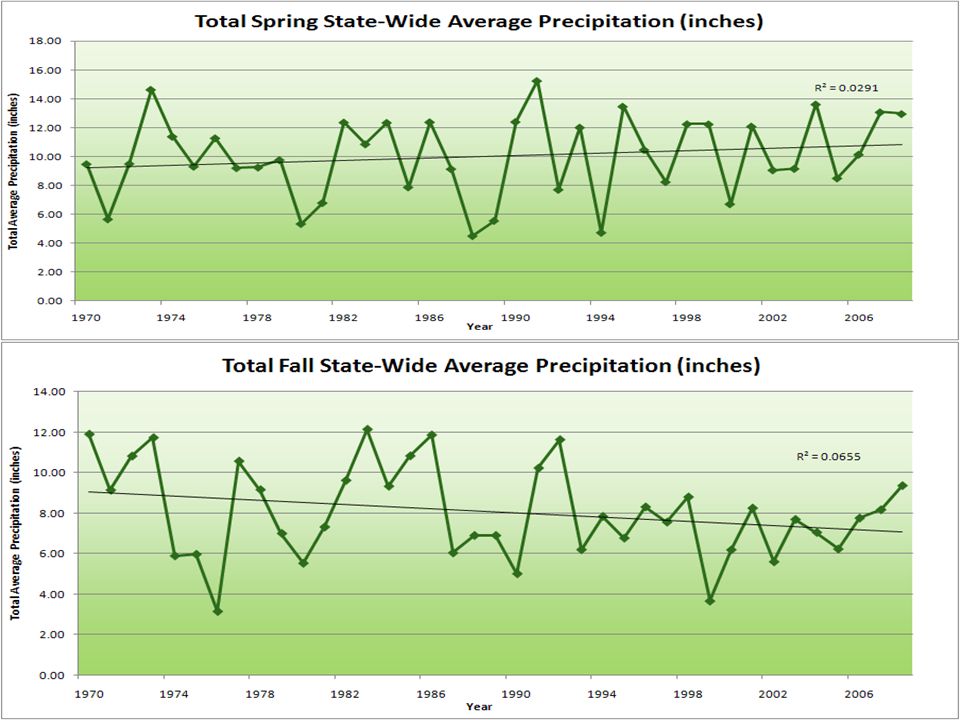
State-Wide Average Data

24
Cedar Rapids Data

25
“One of the clearest trends in the United States observational record is an increasing frequency and intensity of heavy precipitation events… Over the last century there was a 50% increase in the frequency of days with precipitation over 101.6 mm (four inches) in the upper midwestern U.S.; this trend is statistically significant “
 in the upper midwestern U.S.; this trend is statistically significant")
26
Cedar Rapids Data

27
D. Herzmann, Iowa Environmental Mesonet

28
Projected Changes* for the Climate of the Midwest Temperature Longer frost-free period (high) Higher average winter temperatures (high) Fewer extreme cold temperatures in winter (high) Fewer extreme high temperatures in summer in short term but more in long term (medium) Higher nighttime temperatures both summer and winter (high) More freeze-thaw cycles (high) Increased temperature variability (high) Longer frost-free period (high) Higher average winter temperatures (high) Fewer extreme cold temperatures in winter (high) Fewer extreme high temperatures in summer in short term but more in long term (medium) Higher nighttime temperatures both summer and winter (high) More freeze-thaw cycles (high) Increased temperature variability (high) Follows trend of last 25 years and projected by models No current trend but model suggestion or current trend but model inconclusive *Estimated from IPCC reports
 Higher average winter temperatures (high) Fewer extreme cold temperatures in winter (high) Fewer extreme high temperatures in summer in short term but more in long term (medium) Higher nighttime temperatures both summer and winter (high) More freeze-thaw cycles (high) Increased temperature variability (high) Longer frost-free period (high) Higher average winter temperatures (high) Fewer extreme cold temperatures in winter (high) Fewer extreme high temperatures in summer in short term but more in long term (medium) Higher nighttime temperatures both summer and winter (high) More freeze-thaw cycles (high) Increased temperature variability (high) Follows trend of last 25 years and projected by models No current trend but model suggestion or current trend but model inconclusive *Estimated from IPCC reports")
29
More (~10%) precipitation annually (medium) Change in “seasonality”: Most of the increase will come in the first half of the year (wetter springs, drier summers) (high) More water-logging of soils (medium) More variability of summer precipitation (high) More intense rain events and hence more runoff (high) Higher episodic streamflow (medium) Longer periods without rain (medium) Higher absolute humidity (high) Stronger storm systems (medium) More winter soil moisture recharge (medium) Snowfall increases (late winter) in short term but decreases in the long run (medium) More (~10%) precipitation annually (medium) Change in “seasonality”: Most of the increase will come in the first half of the year (wetter springs, drier summers) (high) More water-logging of soils (medium) More variability of summer precipitation (high) More intense rain events and hence more runoff (high) Higher episodic streamflow (medium) Longer periods without rain (medium) Higher absolute humidity (high) Stronger storm systems (medium) More winter soil moisture recharge (medium) Snowfall increases (late winter) in short term but decreases in the long run (medium) *Estimated from IPCC reports Projected Changes* for the Climate of the Midwest Precipitation Follows trend of last 25 years and projected by models No current trend but model suggestion or current trend but model inconclusive
 precipitation annually (medium) Change in seasonality : Most of the increase will come in the first half of the year (wetter springs, drier summers) (high) More water-logging of soils (medium) More variability of summer precipitation (high) More intense rain events and hence more runoff (high) Higher episodic streamflow (medium) Longer periods without rain (medium) Higher absolute humidity (high) Stronger storm systems (medium) More winter soil moisture recharge (medium) Snowfall increases (late winter) in short term but decreases in the long run (medium) More (~10%) precipitation annually (medium) Change in seasonality : Most of the increase will come in the first half of the year (wetter springs, drier summers) (high) More water-logging of soils (medium) More variability of summer precipitation (high) More intense rain events and hence more runoff (high) Higher episodic streamflow (medium) Longer periods without rain (medium) Higher absolute humidity (high) Stronger storm systems (medium) More winter soil moisture recharge (medium) Snowfall increases (late winter) in short term but decreases in the long run (medium) *Estimated from IPCC reports Projected Changes* for the Climate of the Midwest Precipitation Follows trend of last 25 years and projected by models No current trend but model suggestion or current trend but model inconclusive")
30
Reduced wind speeds (high) Reduced solar radiation (medium) Increased tropospheric ozone (high) Accelerated loss of soil carbon (high) Phenological stages are shortened (high) Weeds grow more rapidly under elevated atmospheric CO2 (high) Weeds migrate northward and are less sensitive to herbicides (high) Plants have increased water used efficiency (high) Reduced wind speeds (high) Reduced solar radiation (medium) Increased tropospheric ozone (high) Accelerated loss of soil carbon (high) Phenological stages are shortened (high) Weeds grow more rapidly under elevated atmospheric CO2 (high) Weeds migrate northward and are less sensitive to herbicides (high) Plants have increased water used efficiency (high) Follows trend of last 25 years and projected by models No current trend but model suggestion or current trend but model inconclusive *Estimated from IPCC and CCSP reports Projected Changes* for the Climate of the Midwest Other
 Reduced solar radiation (medium) Increased tropospheric ozone (high) Accelerated loss of soil carbon (high) Phenological stages are shortened (high) Weeds grow more rapidly under elevated atmospheric CO2 (high) Weeds migrate northward and are less sensitive to herbicides (high) Plants have increased water used efficiency (high) Reduced wind speeds (high) Reduced solar radiation (medium) Increased tropospheric ozone (high) Accelerated loss of soil carbon (high) Phenological stages are shortened (high) Weeds grow more rapidly under elevated atmospheric CO2 (high) Weeds migrate northward and are less sensitive to herbicides (high) Plants have increased water used efficiency (high) Follows trend of last 25 years and projected by models No current trend but model suggestion or current trend but model inconclusive *Estimated from IPCC and CCSP reports Projected Changes* for the Climate of the Midwest Other")
31
Successful Farming Jan 2010 Dan Looker (used by permission)
")
32
Summary of Impacts: Agriculture Droughts and floods Soil erosion Accelerated weed growth Soil carbon gain or loss Commodity crops Frost-free days Last spring frost, first fall frost Intensive heat during pollination Pests and pathogens Fungus, molds, toxins Soils compaction Water logging of soils Fall crop dry-down Harvest conditions Hail Droughts and floods Soil erosion Accelerated weed growth Soil carbon gain or loss Commodity crops Frost-free days Last spring frost, first fall frost Intensive heat during pollination Pests and pathogens Fungus, molds, toxins Soils compaction Water logging of soils Fall crop dry-down Harvest conditions Hail Energy crops Specialty crops Animal agriculture Milk and egg production Breeding success Weight gains in meat animals Animal health (heat, freezing precipitation) Disease Agricultural soil drainage Pests and pathogens More favorable conditions due to higher humidity and more leaf wetness More overwintering due to more mild winter temperatures Impact of wind farms on crops List likely not complete
 Disease Agricultural soil drainage Pests and pathogens More favorable conditions due to higher humidity and more leaf wetness More overwintering due to more mild winter temperatures Impact of wind farms on crops List likely not complete")
33
Lakes and streams Water quantity Water quality Recreation impacts Aquatic ecosystems Streamflow, major rivers Transportation disruption Ecosystem resilience Flooding Increased installation of drainage tile changes peak flow Reservoirs Managing water levels More extreme precipitation events Increased installation of drainage tile changes inflow rates Siltation Rural and urban water supplies Quantity Quality Lakes and streams Water quantity Water quality Recreation impacts Aquatic ecosystems Streamflow, major rivers Transportation disruption Ecosystem resilience Flooding Increased installation of drainage tile changes peak flow Reservoirs Managing water levels More extreme precipitation events Increased installation of drainage tile changes inflow rates Siltation Rural and urban water supplies Quantity Quality Summary of Impacts: Water List likely not complete

34
Human Health Heat waves Disease vectors Hazard mitigation (health effects of floods) Molds more groundwater and wet basements higher ambient dew point temperatures Ecosystems Functioning Invasive species Ecosystem services Fish and wildlife Human Health Heat waves Disease vectors Hazard mitigation (health effects of floods) Molds more groundwater and wet basements higher ambient dew point temperatures Ecosystems Functioning Invasive species Ecosystem services Fish and wildlife Energy Production and consumption Wind power resource availability Solar power resource availability Biomass Energy demand Infrastructure Roads, bridges Building codes Communities Planning (flood plain, energy conservation) Water systems Summary of Impacts : Other List likely not complete
 Molds more groundwater and wet basements higher ambient dew point temperatures Ecosystems Functioning Invasive species Ecosystem services Fish and wildlife Human Health Heat waves Disease vectors Hazard mitigation (health effects of floods) Molds more groundwater and wet basements higher ambient dew point temperatures Ecosystems Functioning Invasive species Ecosystem services Fish and wildlife Energy Production and consumption Wind power resource availability Solar power resource availability Biomass Energy demand Infrastructure Roads, bridges Building codes Communities Planning (flood plain, energy conservation) Water systems Summary of Impacts : Other List likely not complete")
35
For More Information Contact me directly: gstakle@iastate.edu Current research on regional climate and climate change is being conducted at Iowa State University under the Regional Climate Modeling Laboratory http://rcmlab.agron.iastate.edu/ North American Regional Climate Change Assessment Program http://www.narccap.ucar.edu/ For current activities on the ISU campus, regionally and nationally relating to climate change see the Climate Science Initiative website: http://climate.agron.iastate.edu/ Contact me directly: gstakle@iastate.edu Current research on regional climate and climate change is being conducted at Iowa State University under the Regional Climate Modeling Laboratory http://rcmlab.agron.iastate.edu/ North American Regional Climate Change Assessment Program http://www.narccap.ucar.edu/ For current activities on the ISU campus, regionally and nationally relating to climate change see the Climate Science Initiative website: http://climate.agron.iastate.edu/ Or just Google Eugene Takle

37
Cooling Decade in a Century of Warming Easterling, D. R., and M. F. Wehner, 2009: Is the climate warming or cooling? Geophys. Res. Lett., 36, L08706, doi:10.1029/2009GL037810, 2009 Probability distribution functions for decadal trends (kelvin/year) in globally averaged surface air temperature Probability of a cooling decade in a century of warming
 in globally averaged surface air temperature Probability of a cooling decade in a century of warming.")
Similar presentations


 Agriculture Impacts Impacts of Climate Change on Agriculture Assembled by Brian Viner and Gene Takle.>")


