Download presentation
Presentation is loading. Please wait.

2
What was our definition of population? Researchers study populations in the following ways: Geographic Range Density and Distribution Growth Rate Age Structure

3
Definition: The area inhabited by a population Range can differ depending on the species Bacteria vs. Humans vs. Cod

4
Population Density is the number of individuals per unit area It is like a class roster, we have so many people in this room at this time. Populations of different species can be different even in the same environment

5
Distribution is how individuals are spaced out across the range. The three are Random, Uniform, or Clumped

6
Growth rate determines whether the population increases, decreases, or stays the same. What could lead to increases? Decreases? Staying the same?

7
Birth Immigration: moving into the area Death Emigration: moving out of the area

8
Age structure is the number of males and females of each age in a population Why would we need to know this?

9
If you provide a group of animals with food, shelter, healthcare, and everything else they need to survive, how will they grow?

10
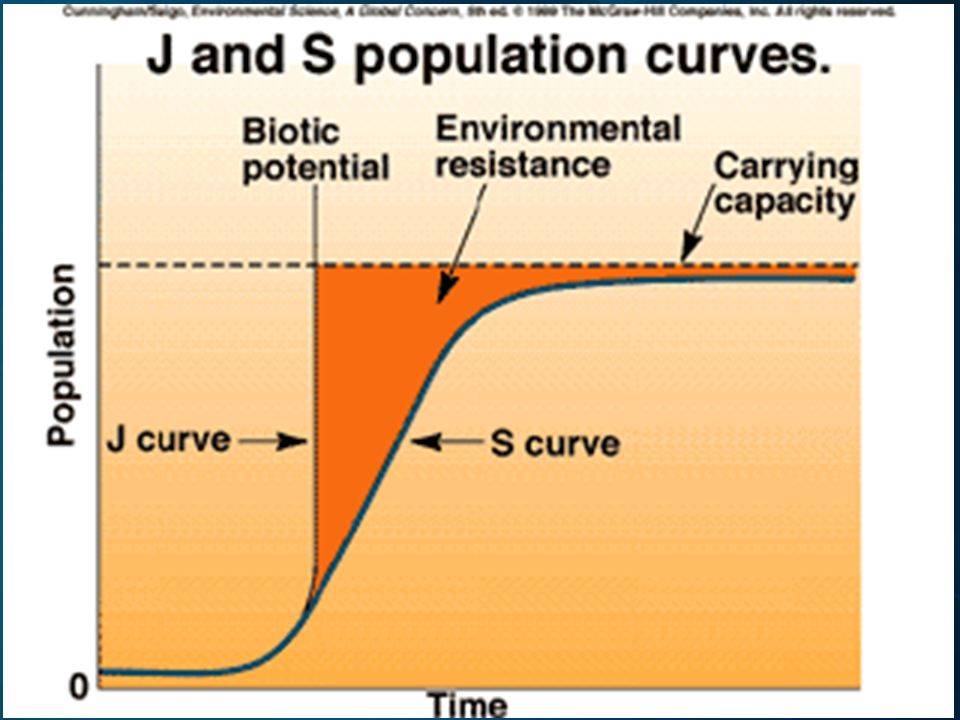
Growth pattern where the population reproduces at a constant rate The larger the population gets, the faster it grows With unlimited resources, a population will grow exponentially

11
Bacteria Graph

12
Graph example

15
Eventually they all created a “J-shape” curve at the end This is the key characteristic of the exponential growth curve graph.

16
So what happens if an animal does not have ideal conditions and protection from everything? It slows or even stops growing! Logistic growth: occurs when a population’s growth slows and then stops, following a period of exponential growth

19
All of these contribute to creating the carrying capacity This makes the line have an “S-shape” curve OBJECTIVE # 5!!!!! Carrying capacity: the max number of individuals of a particular species that a particular environment can support.

21
Limiting factor is a factor (something) that controls the growth of a population We’ve mentioned one of the types at the end of last chapter… Limiting factors determine the carrying capacity
 that controls the growth of a population We’ve mentioned one of the types at the end of last chapter… Limiting factors determine the carrying capacity")
22
Population G.O. from book

23
Density-Dependent: operates when population density (# of species in the area) reaches a certain level.
 reaches a certain level.")
24
Competition… Why? More individuals living in the area, the sooner they use up resources which leads to decrease of both species Parasitism and Disease… Why? The more individuals (hosts), the easier it is for the parasites to spread. This can cause lower births of host and sometimes death from disease
, the easier it is for the parasites to spread. This can cause lower births of host and sometimes death from disease.")
25
Overcrowding…. Why? Too many leads to not very many food source, shelters, etc… which will cause lower births and higher deaths Predator-Prey…. Why? Both predator and prey will go up and down over the course of the years. Each one keeps the other in balance. Easier to look at a graph.

28
These factors happen to all populations regardless of population size and density. Can be things like weather conditions (hurricanes, tornadoes, droughts) and natural disasters (wildfires)
 and natural disasters (wildfires).")
29
Agriculture: produces a dependable supply of food that can be stored for later use. Critical to our survival It has led to doubling the worlds food over 50 years Impacts natural resources like water and soil How? Fertilizers and Farm Equipment use Fossil Fuels Why is this bad?

30
The development of cities and housing Cities led to suburbs developing on the outside Why is this bad? Human communities produce lots of waste If not disposed, can affect air, water and soil Housing splits farmland and divides natural habitats

31
Provides us with all of our modern gadgets and gizmos How would this be bad? Take a lot of energy to produce (burns fossil fuels) Usually discards waste directly in air, water, or soil
 Usually discards waste directly in air, water, or soil.")
32
Much like our Economy, Ecosystems provide us with “good and services” This is anything that benefit the human economy These are classified as renewable resources and nonrenewable resources

33
Can be produced and replaced by a health ecosystem Ex: Trees We can cut one down and another one can grow in its place Natural processes cannot replenish them within a reasonable amount of time Ex: Fossil fuels like coal, oil, and natural gas These are formed from buried organic materials over millions of years. When they are gone, its essentially forever.

34
This provides for human needs while preserving the ecosystems that produce natural resources What would we want it to look like? No long term damage to soil, water, and climate Flexible to survive environmental stresses It must no only help us survive, but improve our lives

35
Healthy soil helps both agriculture and forestry Bad things that we can do to the soil Desertification: over farming, overgrazing, seasonal drought, and climate change that turns a farmland into desert. Deforestation: loss of forests Bad because trees help keep soil in place with roots

36
We need it for: drinking water, industry, transportation, energy, and waste disposal How we affect it: Pollutants: harmful material that can enter a biosphere EX: DDT How we try to fix it: Pollution control, Water Cycle, conservation

38
We need it for: Breathing, Greenhouse effect How we affect it: Smog: a gray-brown haze formed by pollutants in air Acid Rain: Burning fossil fuels causes this and will damage buildings and plant life Greenhouse Gases Particulates How we are fixing it: Filters, unleaded gasoline

Similar presentations