Download presentation
Presentation is loading. Please wait.

1
Image courtesy of NASA/GSFC

2
PROJECT TO INTERCOMPARE REGIONAL CLIMATE SIMULATIONS Global Environmental Change: Technology and the Future of Planet Earth Eugene S. Takle, PhD, CCM Professor of Atmospheric Science Department of Geological and Atmospheric Sciences Professor of Agricultural Meteorology Department of Agronomy Iowa State University Ames, Iowa 50011 gstakle@iastate.edu Globalization Course Cedar Rapids Iowa 19 October 2007

3
PROJECT TO INTERCOMPARE REGIONAL CLIMATE SIMULATIONS Outline Changes in atmospheric carbon dioxide Radiative forcing Simulations of global climate and future climate change Climate change and the scientific process Four components for addressing climate change Except where noted as personal views or from the ISU Global Change course, all materials presented herein are from peer-reviewed scientific reports

4
CO 2, CH 4 and temperature records from Antarctic ice core data Source: Vimeux, F., K.M. Cuffey, and Jouzel, J., 2002, "New insights into Southern Hemisphere temperature changes from Vostok ice cores using deuterium excess correction", Earth and Planetary Science Letters, 203, 829-843.

5
CO 2, CH 4 and temperature records from Antarctic ice core data Source: Vimeux, F., K.M. Cuffey, and Jouzel, J., 2002, "New insights into Southern Hemisphere temperature changes from Vostok ice cores using deuterium excess correction", Earth and Planetary Science Letters, 203, 829-843. Natural cycles Pattern repeats about every 100,000 years

6
IPCC Third Assessment Report

7
PROJECT TO INTERCOMPARE REGIONAL CLIMATE SIMULATIONS 2007 380 ppm Carbon Dioxide and Temperature

8
PROJECT TO INTERCOMPARE REGIONAL CLIMATE SIMULATIONS 2050 550 ppm Carbon Dioxide and Temperature

9
PROJECT TO INTERCOMPARE REGIONAL CLIMATE SIMULATIONS “Business as Usual” 950 ppm Carbon Dioxide and Temperature

10
PROJECT TO INTERCOMPARE REGIONAL CLIMATE SIMULATIONS “Business as Usual” 950 ppm ? Carbon Dioxide and Temperature

11
http://www.ncdc.noaa.gov/img/climate/research/2006/ann/glob_jan-dec-error-bar_pg.gif

12
Mann, M. E., R. S. Bailey, and M. K. Hughes, 1999: Geophysical Research Letters 26, 759.

13
Source: IPCC, 2001: Climate Change 2001: The Scientific Basis

15
PROJECT TO INTERCOMPARE REGIONAL CLIMATE SIMULATIONS

16
IPCC Fourth Assessment Report Summary for Policy Makers

17
Hansen, Scientific American, March 2004 Mt. Pinatubo (1991) El Chichon (1982) Agung, 1963 At present trends the imbalance = 1 Watt/m 2 in 2018
 El Chichon (1982) Agung, 1963 At present trends the imbalance = 1 Watt/m 2 in")
18
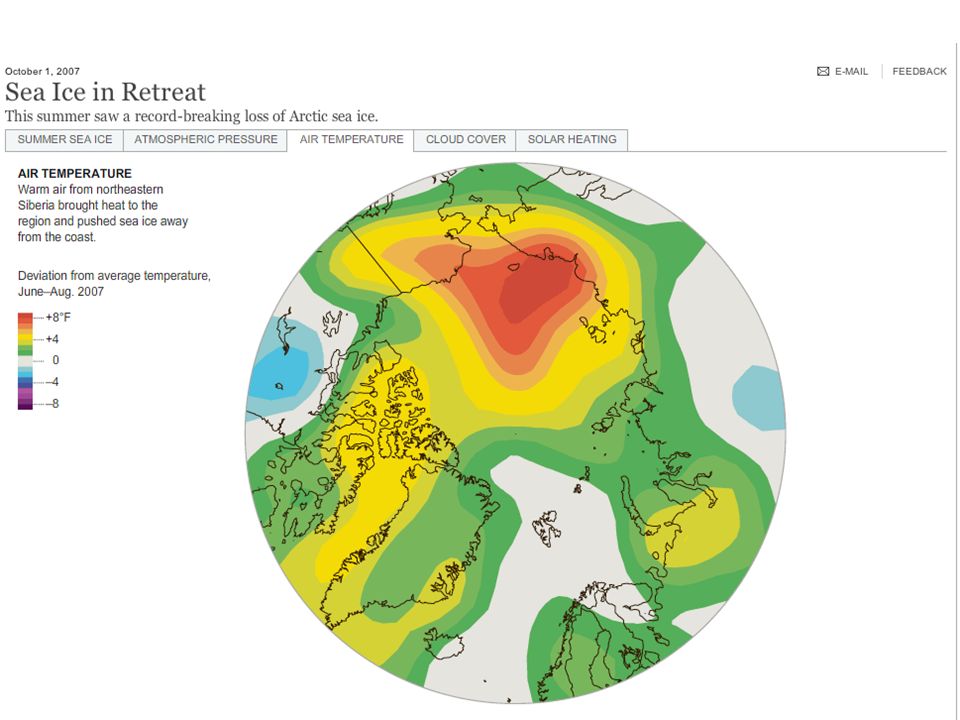
NASA photographs show the minimm Arctic sea ice concentration in 1979 at left and in 2003.Satellite passive microwave data since 1970s indicate a 3% decrease per decade in arctic sea ice extent.

27
Source: Corell, R. W., 2004: Impacts of a warming Arctic. Arctic Climate Impact Assessment (www.acia.uaf.edu) Cambridge University Press (www.cambridge.org).www.acia.uaf.edu

28
Areas subjected to Inundation with a 1 m (~3 ft) rise in sea level Kennedy Space Center Miami Impact of a 1-m rise in sea level on low-lying areas Source: Corell, R. W., 2004: Impacts of a warming Arctic. Arctic Climate Impact Assessment (www.acia.uaf.edu) Cambridge University Press (www.cambridge.org).www.acia.uaf.edu Projected sea-level rise In 21st century: 0.5 to 1.0 m

29
PROJECT TO INTERCOMPARE REGIONAL CLIMATE SIMULATIONS

31
Climate Cold Warm Ice Volume 0 Antarctica Greenland

32
PROJECT TO INTERCOMPARE REGIONAL CLIMATE SIMULATIONS Hansen, Scientific American, March 2004

33
http://www.ncdc.noaa.gov/img/climate/research/2006/ann/glob_jan-dec-error-bar_pg.gif

34
Natural and anthropogenic contributions to global temperature change (Meehl et al., 2004). Observed values from Jones and Moberg 2001. Grey bands indicate 68% and 95% range derived from multiple simulations.

35
Natural cycles

36
Natural and anthropogenic contributions to global temperature change (Meehl et al., 2004). Observed values from Jones and Moberg 2001. Grey bands indicate 68% and 95% range derived from multiple simulations. Not Natural

37
Natural and anthropogenic contributions to global temperature change (Meehl et al., 2004). Observed values from Jones and Moberg 2001. Grey bands indicate 68% and 95% range derived from multiple simulations. Not Natural Highly Likely Not Natural

38
Source: Jerry Meehl, National Center for Atmospheric Research

39
IPCC Fourth Assessment Report Summary for Policy Makers

40
PROJECT TO INTERCOMPARE REGIONAL CLIMATE SIMULATIONS IPCC Fourth Assessment Report Summary for Policy Makers Reduced Consumption Energy intensive Energy conserving

41
PROJECT TO INTERCOMPARE REGIONAL CLIMATE SIMULATIONS IPCC Fourth Assessment Report Summary for Policy Makers The planet is committed to a warming over the next 50 years regardless of political decisions Energy intensive Energy conserving Reduced Consumption

42
PROJECT TO INTERCOMPARE REGIONAL CLIMATE SIMULATIONS IPCC Fourth Assessment Report Summary for Policy Makers Reduced Consumption Energy intensive Energy conserving Adaptation Necessary Mitigation Possible

43
PROJECT TO INTERCOMPARE REGIONAL CLIMATE SIMULATIONS IPCC Fourth Assessment Report Summary for Policy Makers

45
“Warming Hole” T max (JJA) ˚C Pan, Z., R. W. Arritt, E. S. Takle, W. J. Gutowski, Jr., C. J. Anderson, and M. Segal, 2004: Altered hydrologic feedback in a warming climate introduces a “warming hole”. Geophys. Res. Lett.31, L17109, doi:10.1029/2004GL020528.

46
Observed summer (June-July-August) daily mean temperature changes (K) between 1976-2000 (Adapted from Folland et al. [2001]).
..")
47
Precipitation minus Evaporation for Western US (25N-40N, 95W- 125 W) R. Seager, et al., 2007. Model Projections of an Imminent Transition to a More Arid Climate in Southwestern North America. Science, Vol. 316. no. 5828, pp. 1181 - 1184

48
Precipitation minus Evaporation for Western US (25N-40N, 95W-125 W) R. Seager, et al.,2007. Model Projections of an Imminent Transition to a More Arid Climate in Southwestern North America. Science, Vol. 316. no. 5828, pp. 1181 - 1184

49
Precipitation minus Evaporation for Western US (25N-40N, 95W-125 W) R. Seager, et al.,2007. Model Projections of an Imminent Transition to a More Arid Climate in Southwestern North America. Science, Vol. 316. no. 5828, pp. 1181 - 1184 Colorado River Compact established, 1922

50
PROJECT TO INTERCOMPARE REGIONAL CLIMATE SIMULATIONS Exposing Anthropogenic Climate Change to Standard Scientific Evaluation Methodological –Inductive (specific to general) –Deductive (general to specific) –Falsifiable (testable; does not rely on articles of faith) Evidentiary : Strong consistency of evidence –Instrumental records (temperature, satellite obs) –proxy records (tree rings, lake sediments, bore holes, etc.) Performance –Prediction –Provide useful advice Inference to best explanation –All available evidence points towards role of human effects. Community standards Naomi Oreskes, 2007

51
1970’s: Debate about Global Cooling: what to do? Refer question to the National Academy of Sciences.

52
PROJECT TO INTERCOMPARE REGIONAL CLIMATE SIMULATIONS National Academy of Sciences The NAS was signed into being by President Abraham Lincoln on March 3, 1863, at the height of the Civil War. As mandated in its Act of Incorporation, the NAS has, since 1863, served to "investigate, examine, experiment, and report upon any subject of science or art" whenever called upon to do so by any department of the government.

53
PROJECT TO INTERCOMPARE REGIONAL CLIMATE SIMULATIONS So what did the Academy say? "Our knowledge of the mechanisms of climatic change is at least as fragmentary as our data…Not only are the basic scientific questions largely unanswered, but in many cases we do not yet know enough to pose the key questions” Connolley, W. M., 1975: UNDERSTANDING CLIMATE CHANGE: A program for action. US National Academy of Sciences/National Research Council Report

54
PROJECT TO INTERCOMPARE REGIONAL CLIMATE SIMULATIONS Intergovernmental Panel on Climate Change (IPCC) Created in 1988 by the World Meteorological Organization (UN) and the United Nations Environmental Programme IPCC purpose is to evaluate the state of climate science as a basis for informed policy action, primarily on the basis of peer-reviewed and published scientific literature
 Created in 1988 by the World Meteorological Organization (UN) and the United Nations Environmental Programme IPCC purpose is to evaluate the state of climate science as a basis for informed policy action, primarily on the basis of peer-reviewed and published scientific literature")
55
PROJECT TO INTERCOMPARE REGIONAL CLIMATE SIMULATIONS NAS Assessment of IPCC Conclusions “Greenhouse gases are accumulating in the Earth’s atmosphere as a result of human activities, causing surface air temperatures to rise and sub-surface ocean temperatures to rise” “The IPCC’s conclusion that most of the observed warming of the last 50 years is likely to have been due to the increase in greenhouse gas concentrations accurately reflects the current thinking of the scientific community on this issue” National Academy of Sciences Committee on the Science of Climate Change, 2001: Climate change science: An analysis of some key questions. National Academy Press.

56
PROJECT TO INTERCOMPARE REGIONAL CLIMATE SIMULATIONS IPCC AR4 (2007) Process IPCC does not conduct its own research. It simply organizes teams of scientists to evaluate the current state of scientific knowledge People from over 130 countries contributed to the IPCC Fourth Assessment Report over the previous 6 years. These people included more than 2500 scientific expert reviewers, more than 850 contributing authors, and more than 450 lead authors

57
PROJECT TO INTERCOMPARE REGIONAL CLIMATE SIMULATIONS IPCC Fourth Assessment Report (2007) “The understanding of anthropogenic warming and cooling influences on climate has improved since the Third Assessment Report (TAR), leading to very high confidence that the globally averaged net effect of human activities since 1750 has been one of warming, with a radiative forcing of +1.6 [+0.6 to +2.4] W m -2.”
![PROJECT TO INTERCOMPARE REGIONAL CLIMATE SIMULATIONS IPCC Fourth Assessment Report (2007) The understanding of anthropogenic warming and cooling influences on climate has improved since the Third Assessment Report (TAR), leading to very high confidence that the globally averaged net effect of human activities since 1750 has been one of warming, with a radiative forcing of +1.6 [+0.6 to +2.4] W m -2.](http://images.slideplayer.com./33/8205443/slides/slide_57.jpg "PROJECT TO INTERCOMPARE REGIONAL CLIMATE SIMULATIONS IPCC Fourth Assessment Report (2007) The understanding of anthropogenic warming and cooling influences on climate has improved since the Third Assessment Report (TAR), leading to very high confidence that the globally averaged net effect of human activities since 1750 has been one of warming, with a radiative forcing of +1.6 [+0.6 to +2.4] W m -2.")
58
PROJECT TO INTERCOMPARE REGIONAL CLIMATE SIMULATIONS IPCC AR4 Conclusions Warming of the climate system is unequivocal. Most of (>50% of) the observed increase in globally averaged temperatures since the mid-20th century is very likely (confidence level >90%) due to the observed increase in anthropogenic (human) greenhouse gas concentrations. Hotter temperatures and rises in sea level "would continue for centuries" even if greenhouse gas levels are stabilized, although the likely amount of temperature and sea level rise varies greatly depending on the fossil intensity of human activity during the next century.
 the observed increase in globally averaged temperatures since the mid-20th century is very likely (confidence level >90%) due to the observed increase in anthropogenic (human) greenhouse gas concentrations. Hotter temperatures and rises in sea level would continue for centuries even if greenhouse gas levels are stabilized, although the likely amount of temperature and sea level rise varies greatly depending on the fossil intensity of human activity during the next century..")
59
PROJECT TO INTERCOMPARE REGIONAL CLIMATE SIMULATIONS IPCC AR4 Conclusions The probability that this is caused by natural climatic processes alone is less than 5%. World temperatures could rise by between 1.1 and 6.4 °C (2.0 and 11.5 °F) during the 21st century and that: Sea levels will probably rise by 18 to 59 cm (7.08 to 23.22 in). There is a confidence level >90% that there will be more frequent warm spells, heat waves and heavy rainfall.
 during the 21st century and that: Sea levels will probably rise by 18 to 59 cm (7.08 to in). There is a confidence level >90% that there will be more frequent warm spells, heat waves and heavy rainfall..")
60
PROJECT TO INTERCOMPARE REGIONAL CLIMATE SIMULATIONS IPCC AR4 Conclusions There is a confidence level >66% that there will be an increase in droughts, tropical cyclones and extreme high tides. Both past and future anthropogenic carbon dioxide emissions will continue to contribute to warming and sea level rise for more than a millennium. Global atmospheric concentrations of carbon dioxide, methane, and nitrous oxide have increased markedly as a result of human activities since 1750 and now far exceed pre-industrial values over the past 650,000 years

61
PROJECT TO INTERCOMPARE REGIONAL CLIMATE SIMULATIONS Four-Component Approach for Addressing Climate Change Mitigation policies: 2050-2100 –Example: reduction in GHG emissions Adaptation (long-term): 2015-2050 –Example: Developing Iowa’s competitive economic advantage Adaptation (short-term): 2008-2015 –Example: redefining climate “normals” when needed and scientifically justified Scenario planning for Iowa’s “Katrina”: 2007-2100 –Example: Multi-year drought, recurrent floods, combination of both; drought and wildfire EST personal view
: –Example: Developing Iowa’s competitive economic advantage Adaptation (short-term): –Example: redefining climate normals when needed and scientifically justified Scenario planning for Iowa’s Katrina : –Example: Multi-year drought, recurrent floods, combination of both; drought and wildfire EST personal view")
62
PROJECT TO INTERCOMPARE REGIONAL CLIMATE SIMULATIONS If a meteorological variable began departing from its long-term background near or after 1970 it may be related to the radiation imbalance and thereby has a better chance than not of continuing its new trend over the next 5-10 years. Climate Adaptation(Short-Term) EST personal view
 EST personal view.")
63
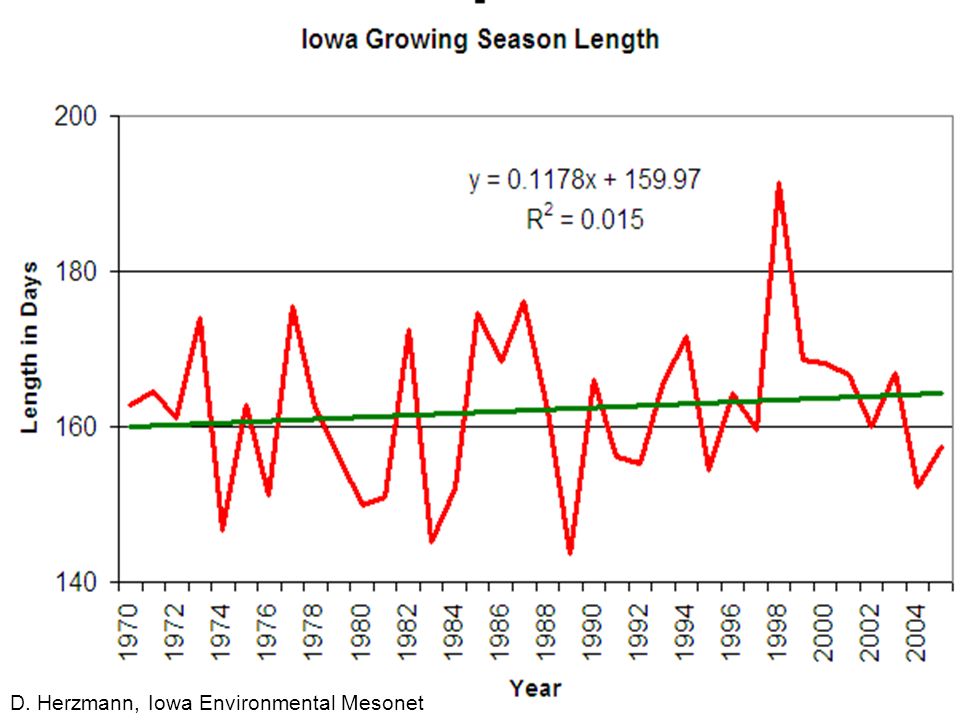
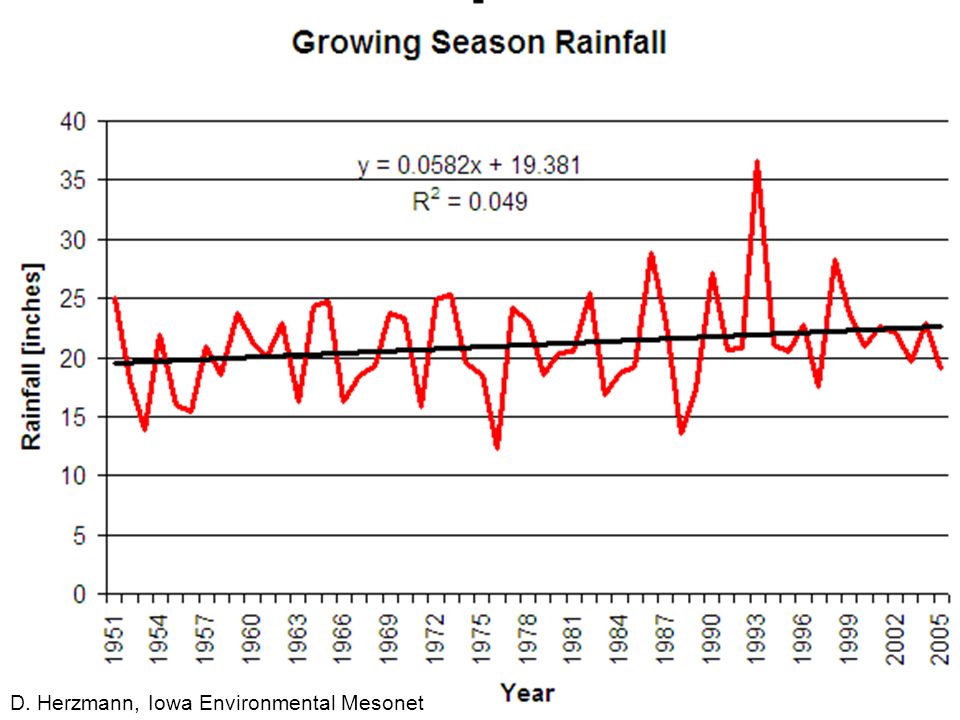
PROJECT TO INTERCOMPARE REGIONAL CLIMATE SIMULATIONS Projected Changes for the Climate of Iowa/Midwest (My tentative assessment) Longer frost-free period (high) Higher average winter temperatures (high) Fewer extreme cold temperatures in winter (high) More extreme high temperatures in summer (medium) Higher nighttime temperatures both summer and winter (high) More (~10%) precipitation (medium) More variability of summer precipitation (high) –More intense rain events and hence more runoff (high) –Higher episodic streamflow (medium) –Longer periods without rain (medium) Higher absolute humidity (high) Stronger storm systems (medium) Reduced annual mean wind speeds (medium) Follows trend of last 25 years and projected by models No current trend but model suggestion or current trend but models inconclusive
 Longer frost-free period (high) Higher average winter temperatures (high) Fewer extreme cold temperatures in winter (high) More extreme high temperatures in summer (medium) Higher nighttime temperatures both summer and winter (high) More (~10%) precipitation (medium) More variability of summer precipitation (high) –More intense rain events and hence more runoff (high) –Higher episodic streamflow (medium) –Longer periods without rain (medium) Higher absolute humidity (high) Stronger storm systems (medium) Reduced annual mean wind speeds (medium) Follows trend of last 25 years and projected by models No current trend but model suggestion or current trend but models inconclusive")
64
North America Regional Climate Change Assessment Program Raymond Arritt, William Gutowski, Gene Takle, Iowa State University Erasmo Buono, Richard Jones, Hadley Centre, UK Daniel Caya, OURANOS, Canada Phil Duffy, Lawrence Livermore National Laboratories, USA Filippo Giorgi, Jeremy Pal, Abdus Salam ICTP, Italy Isaac Held, Ron Stouffer, NOAA Geophysical Fluid Dynamics Laboratory, USA René Laprise, Univ. de Québec à Montréal, Canada Ruby Leung, Pacific Northwest National Laboratories, USA Linda O. Mearns, Doug Nychka, Phil Rasch, Tom Wigley, National Center for Atmospheric Research, USA Ana Nunes, John Roads, Scripps Institution of Oceanography, USA Steve Sain, Univ. of Colorado at Denver, USA Lisa Sloan, Mark Snyder, Univ. of California at Santa Cruz, USA Linda O. Mearns, National Center for Atmospheric Research Principal Investigator http://www.narccap.ucar.edu/

65
PROJECT TO INTERCOMPARE REGIONAL CLIMATE SIMULATIONS Summary Climate change of the past 35 years is not consistent with natural variations over the last 400,000 years Evidence clearly shows that radiative forcing due to anthropogenic greenhouse gases has contributed over half of the warming of the last 35 years Mitigation efforts, although urgently needed, will have little effect on global warming until the latter half of the 21st century Adaptation strategies should be developed for the next 50 years Recent trends and model projections should be used to develop adaptation strategies for the next 10 years EST personal view

66
PROJECT TO INTERCOMPARE REGIONAL CLIMATE SIMULATIONS For More Information For peer-reviewed evidence supporting everything you have seen in this presentation, see my online Global Change course: http://www.meteor.iastate.edu/gccourse Contact me directly: gstakle@iastate.edu Current research on regional climate and climate change is being conducted at Iowa State Unversity under the Regional Climate Modeling Laboratory http://rcmlab.agron.iastate.edu/ North American Regional Climate Change Assessment Program http://www.narccap.ucar.edu/ For this and other climate change presentations see my personal website: http://www.meteor.iastate.edu/faculty/takle/ Or just Google Eugene Takle

67
D. Herzmann, Iowa Environmental Mesonet

Similar presentations


 –Usually.>")


 Working Group I Working Group I Contribution to the IPCC Fourth Assessment Report Climate Change 2007:>")


