Download presentation
Presentation is loading. Please wait.

1
Insights into Climate Dynamics from Paleoclimate Data Michael E. Mann Department of Environmental Sciences University of Virginia Richard Foster Flint Symposium Dynamical Paleoclimatology In Honor of the Memory of Barry Saltzman Yale University, New Haven, CT November 3, 2001 Interannual Through Millennial Timescales

2
OVERVIEW The Instrumental Record Proxy indicators and paleoclimate reconstructions Model/Data comparisons Conclusions

3
Collaborators Rob Allan Ray Bradley Keith Briffa Ed Cook Curt Covey Tom Crowley Heidi Cullen Rosanne D’Arrigo Tom Delworth Chris Folland Malcolm Hughes Phil Jones David Karoly Tim Osborn Jonathan Overpeck David Rind Scott Rutherford Gavin Schmidt Drew Shindell Ron Stouffer Anne Waple

4
The Instrumental Record Proxy indicators and paleoclimate reconstructions Model/Data comparisons Conclusions

5
Instrumental Surface Temperature Record Grayshaded: 1902-1993 Checkboard: 1854-1993 Climatic Research Unit (‘CRU’), University of East Anglia
, University of East Anglia")
6
Instrumental Surface Temperature Record “Niño3” El Niño

7
Climatic Research Unit (‘CRU’) University of East Anglia Instrumental Surface Temperature Record
 University of East Anglia Instrumental Surface Temperature Record")
8
Climate Change 2001: The Scientific Basis, Houghton, J.T., et al. (eds.), Cambridge Univ. Press, Cambridge, 2001
, Cambridge Univ. Press, Cambridge,")
9
Five leading patterns of global temperature variation during the 20th century. Instrumental Surface Temperature Record Mann, M.E., Bradley, R.S., Hughes, M.K., Global-Scale Temperature Patterns and Climate Forcing Over the Past Six Centuries, Nature, 392, 779-787, 1998.

10
The Instrumental Record Proxy indicators and paleoclimate reconstructions Model/Data comparisons Conclusions

11
TREE RINGS

12
CORALS

13
ICE CORES

14
VARVED LAKE SEDIMENTS

15
HISTORICAL DOCUMENTS

16
tree-ring; + PCs of dense tree-ring networks, ice core Ccoral Early instrumental/historical (temperature) Early instrumental/historical (precipitation) Annual Resolution Proxy Climate Indicators
 Early instrumental/historical (precipitation) Annual Resolution Proxy Climate Indicators")
17
Baffin Island Canada Sediment Core Hughen et al, Holocene 10, 1: 9-19 (2000). Fisher et al (eds. Jones, P. D., Bradley, R. S. & Jouzel, J.) (Springer-Verlag Berlin Heidelberg, Berlin, 1996). Ice Core Mongolia Tree Ring D'Arrigo, R. et al, Geophysical Research Letters 28, 543-546 (2001). Annual Resolution Proxy Climate Indicators
 (Springer-Verlag Berlin Heidelberg, Berlin, 1996). Ice Core Mongolia Tree Ring D Arrigo, R. et al, Geophysical Research Letters 28, (2001). Annual Resolution Proxy Climate Indicators.")
18
INSTRUMENTAL TEMPERATURE RECORD GLOBAL PROXY CLIMATE RECORDS Annual Resolution Proxy Climate Indicators

19
Five leading patterns of global temperature variation during the 20th century. Instrumental Surface Temperature Record Mann, M.E., Bradley, R.S., Hughes, M.K., Global-Scale Temperature Patterns and Climate Forcing Over the Past Six Centuries, Nature, 392, 779-787, 1998.

20
Reconstructed Surface Temperatures

21
Mann, M.E., Bradley, R.S., Hughes, M.K., Global-Scale Temperature Patterns and Climate Forcing Over the Past Six Centuries, Nature, 392, 779-787, 1998.

22
Reconstructed Surface Temperatures VERIFICATION

23
Reconstructed Surface Temperatures Climate Change 2001: The Scientific Basis, Houghton, J.T., et al. (eds.), Cambridge Univ. Press, Cambridge, 2001
, Cambridge Univ. Press, Cambridge,")
24
Instrumental Surface Temperature Record “Niño3” El Niño

25
Cold-season Nino3 index Reconstructed Surface Temperatures Climate Change 2001: The Scientific Basis, Houghton, J.T., et al. (eds.), Cambridge Univ. Press, Cambridge, 2001
, Cambridge Univ. Press, Cambridge,")
26
The Instrumental Record Proxy indicators and paleoclimate reconstructions Model/Data comparisons Conclusions

27
Modeled Natural VariabilityObservations

28
Climate Forcings Anthropogenic Greenhouse Gases Industrial Aerosols

29
Natural 100012001400160018002000 Volcanism Solar Climate Forcings

30
Relationship between Northern Hemisphere Temperature and Potential Predictors Volcanism Greenhouse Gases Temperature Mann, M.E., Bradley, R.S., Hughes, M.K., Global-Scale Temperature Patterns and Climate Forcing Over the Past Six Centuries, Nature, 392, 779-787, 1998. Solar Irradiance

31
Simulated Annual Global Mean Surface Temperatures Climate Change 2001: The Scientific Basis, Houghton, J.T., et al. (eds.), Cambridge Univ. Press, Cambridge, 2001 HADCM3 Coupled Ocean- Atmosphere Model
, Cambridge Univ. Press, Cambridge, 2001 HADCM3 Coupled Ocean- Atmosphere Model.")
32
Science

33
Climate Change 2001: The Scientific Basis, Houghton, J.T., et al. (eds.), Cambridge Univ. Press, Cambridge, 2001 Future Surface Temperatures Trends
, Cambridge Univ. Press, Cambridge, 2001 Future Surface Temperatures Trends.")
34
Trend in NAO in past couple decades explains enhanced recent warming in certain regions of Northern Hemisphere North Atlantic Oscillation

35
“Little Ice Age” North Atlantic Oscillation

36
LIA winter cooling in Europe associated with an NAO trend due to solar irradiance changes, interacting w/ stratospheric atmospheric dynamics and chemistry NASA/GISS Model (Shindell et al, in press) Empirical North Atlantic Oscillation
 Empirical North Atlantic Oscillation")
37
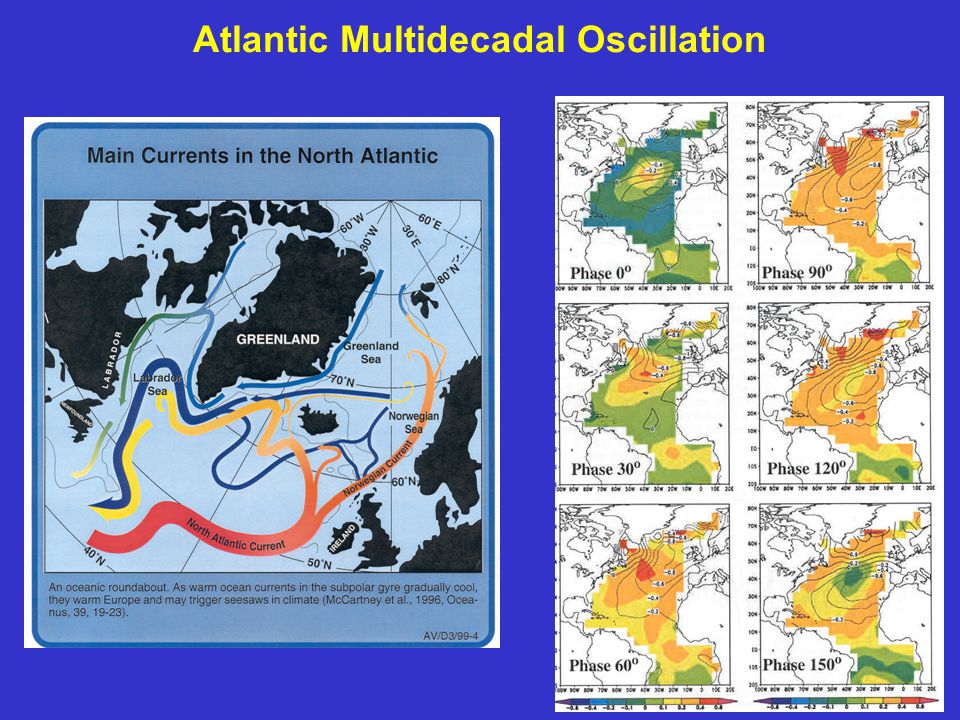
Atlantic Multidecadal Oscillation

40
A clear 50-70 year timescale signal apparently centered in the Atlantic is evident from proxy-reconstructions of SST during the past few centuries

41
The GFDL coupled model exhibits a robust 50-70 year timescale signal, which is insensitive to model resolution Atlantic Multidecadal Oscillation

42
Model Observations Atlantic Multidecadal Oscillation

43
The signal in the model represents a modulation of the intensity of the North Atlantic THC with oceanic feedbacks Signal is oceanic in origin, but is modified by the atmosphere

44
CONCLUSIONS Proxy-based reconstructions of Hemispheric temperature variations over past millennium are consistent with model- based estimates of both forced and internal climate variability 20 th century warming is inconsistent with natural climate variability, but can be explained by anthropogenic influence on climate Little Ice Age temperature reconstructions consistent with enhancement of NAO-type pattern in response to past solar variations produced in recent model simulation Internal multidecadal pattern of climate variability consistent with intrinsic model of ocean-atmosphere variability evident in long control simulations of coupled ocean-atmosphere models.

Similar presentations


 climate change is on a timescale of decades, an example would.>")


>")


 Hans von Storch, Fidel González-Ruoco, Ulrich Cubasch, Jürg Luterbacher,>")


