Download presentation
Presentation is loading. Please wait.

1
1.3 Psychology Statistics AP Psychology Mr. Loomis

2
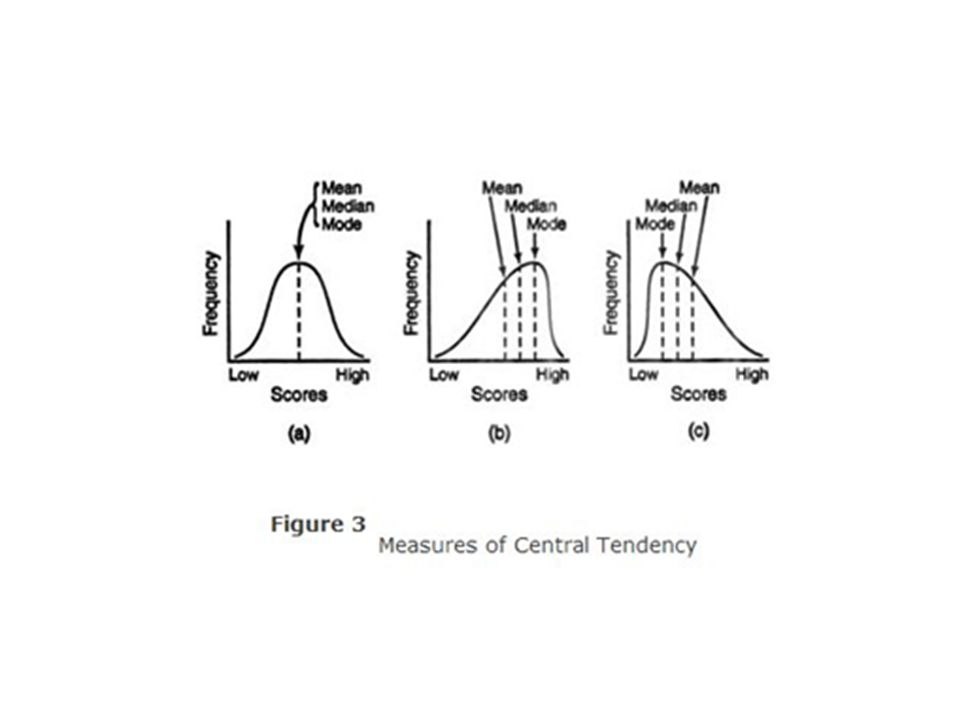
Descriptive Statistics Definition… Describe a set of data Measures of Central Tendency Measures of Variation Skewed Distributions

3
Measures of Central Tendency Mean – Average score – Extreme scores have a greater impact on the mean than on the mode or median Median – Score that divides a frequency distribution exactly in half, so that the same number of scores lie on each side (middle) Mode – Most frequently occurring score (bimodal)
 Mode – Most frequently occurring score (bimodal)")
7
Measures of Variation Definition – Measure of variation in a single score that presents info about the spread of scores in a variation Range – highest minus the lowest Standard Deviation – a standard measurement of how much the scores in a distribution deviate from the mean – The most widely used measure of variation Z-score (standard score) – the distance of a score from the mean in units of standard deviation
 – the distance of a score from the mean in units of standard deviation")
9
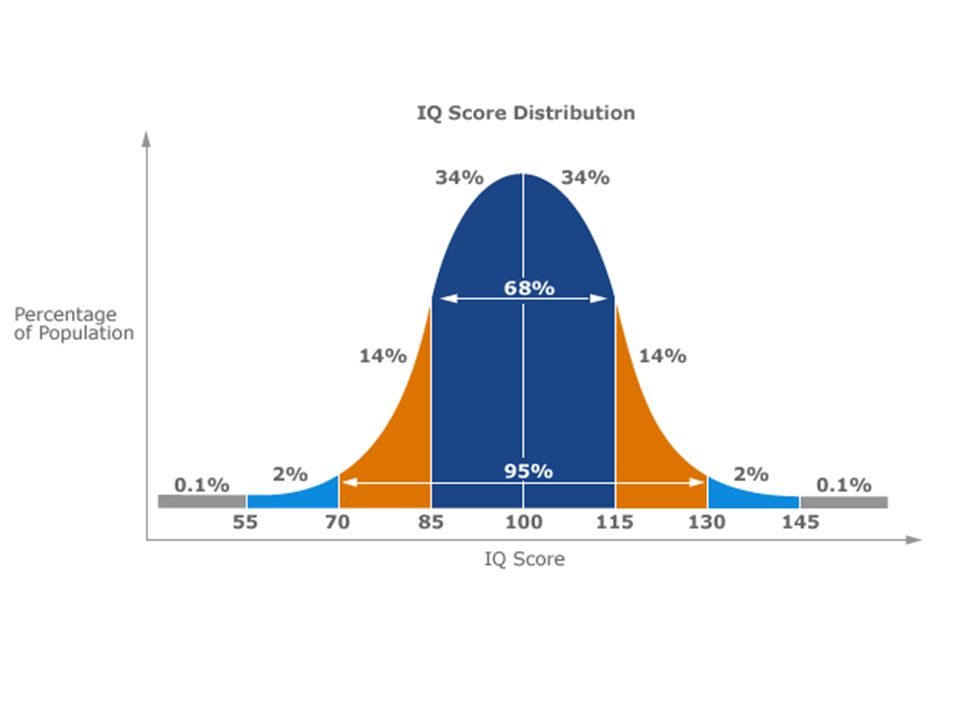
Normal Distribution Form a bell-shaped or symmetrical curve

10
Normal Distribution The percentage of scores that fall at or above the mean is 50…the percentage that fall below (or at) the mean is also 50
 the mean is also 50")
11
Normal Distribution On-third of the scores fall one standard deviation below the mean and on-third fall one standard deviation above the mean Example…Wechsler IQ Tests – Mean = 100 / Standard Deviation = 15 – One-third score 85-100 – Another third score 100-115

13
68-95-99.7 Rule 68% of scores fall within one SD 95% of scores fall within two SD 99.7% of scores fall within three SD

14
Percentile Distance of a score from “0” Examples – 90 th percentile – score better than 90% – 38 th percentile – score better than 38%

16
Skewed Distributions

17
Positively Skewed Distributions Contain a preponderance of scores on the low end of the scale (looks like “P” lying on back Mean is higher than the median – Thus the median is a better representation of central tendency in positively skewed distributions

18
Skewed Distributions Negatively Skewed Distributions Contain a preponderance of scores on the high end of the scale Mean is lower than median – Thus the median is a better representation of central tendency in a negatively skewed distribution

21
Inferential Statistics Key points… Most experiments are conducted with a small sample of subjects Psychologists want to generalize the results from their small sample to a larger population IS are used to determine how likely it is that a study’s outcome is due to chance and whether the outcome can be legitimately generalized to the larger population from the sample selected

24
The P-Value Probability of concluding that a difference exists when in fact this difference does not exist A statistically significant difference is a difference not likely due to chance (shows up 5% of the time or less) Smaller the p-value, the more significant the results Can never be “0” (researchers can never be 100% certain the results did not occur by chance)
 Smaller the p-value, the more significant the results Can never be 0 (researchers can never be 100% certain the results did not occur by chance)")
Similar presentations


 Ordinal scale- Uses numbers for.>")


