Download presentation
Presentation is loading. Please wait.

1
“A look at the oil patch”

9
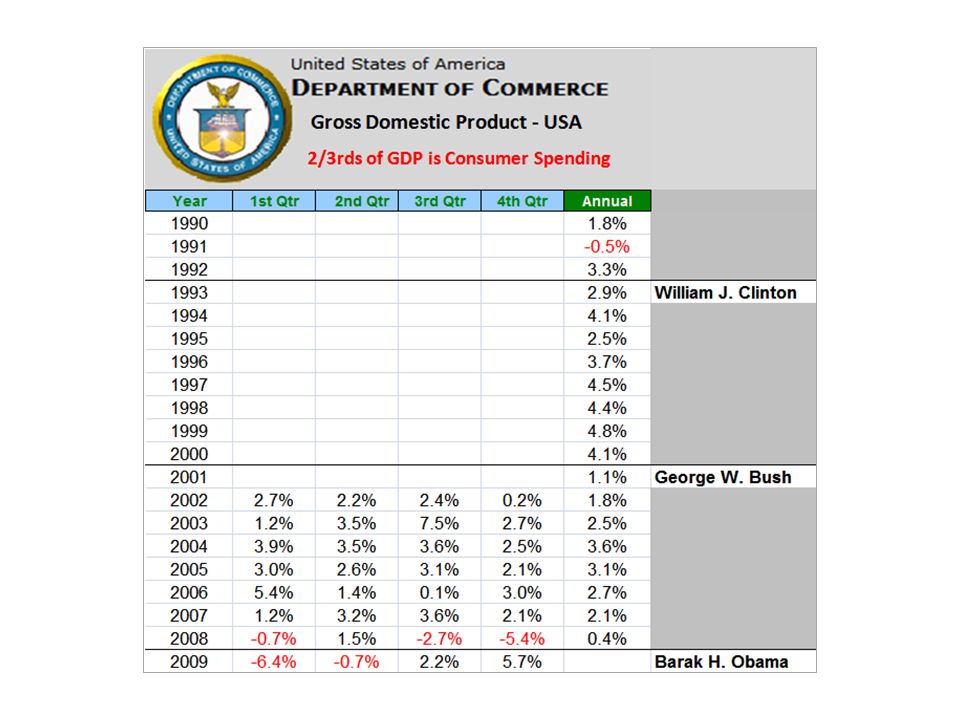
2,417 b/d 1,180 b/d 1,274 b/d 1,084 b/d 679 b/d Of the Total Imports of 12,222,000 b/d, 53.8% come from Countries noted above. 4,984,000 (40.8%) from OPEC, 7,238,000 (59.2%) from Non-OPEC
 from OPEC, 7,238,000 (59.2%) from Non-OPEC.")
30
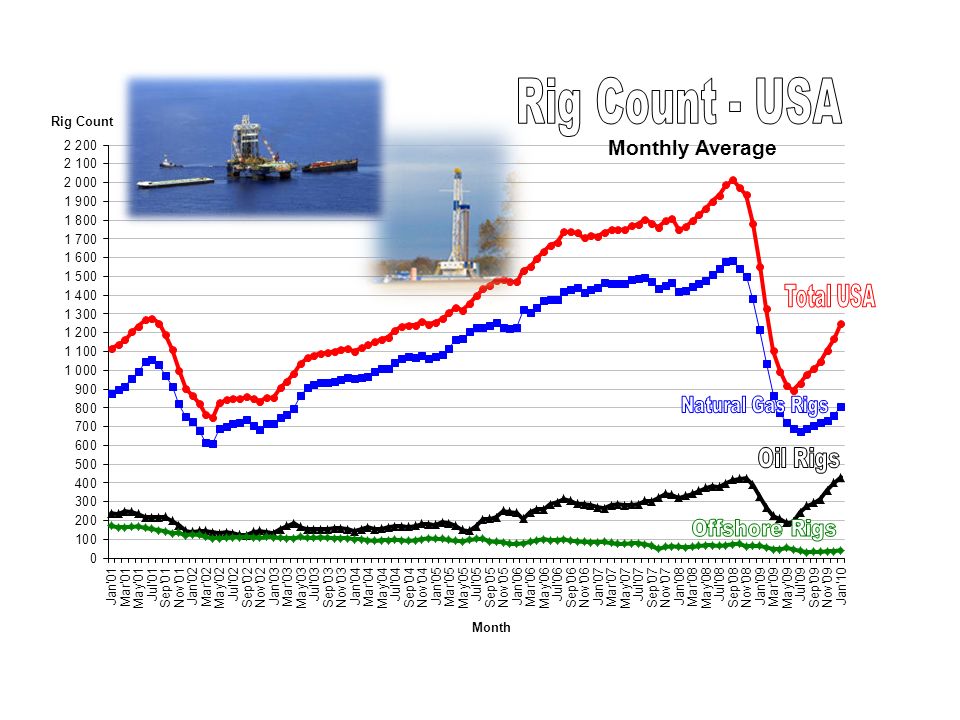
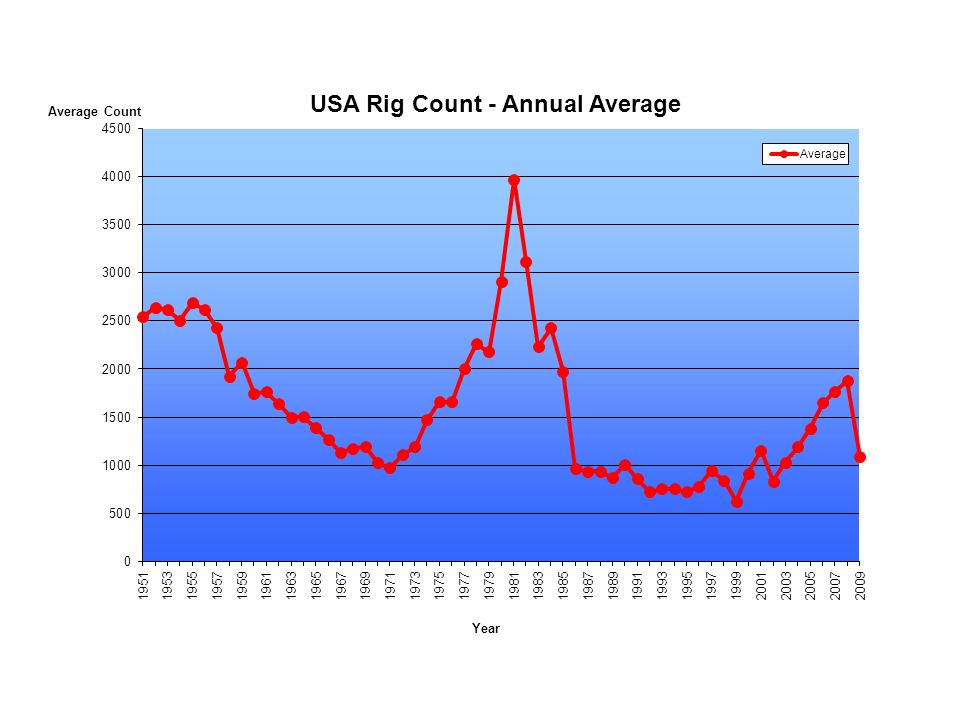
Total Rig Count = 728

32
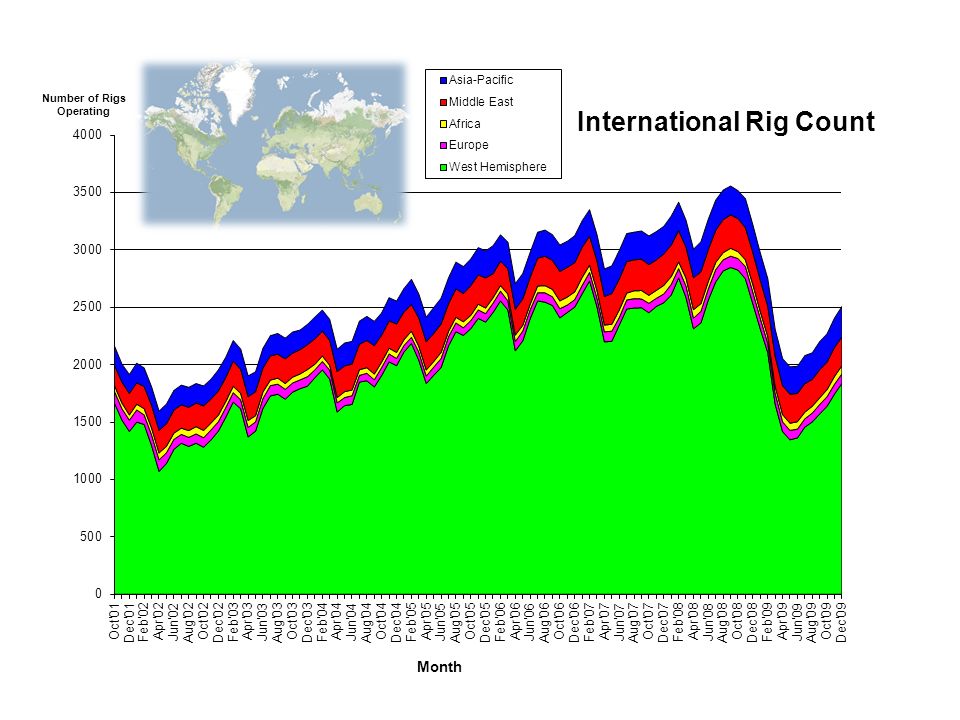
Western Hemisphere 1,838 Europe84 Middle East 251 Asian-Pacific266 Africa70 Russian/a Chinan/a

33
North America 1,607 South America 231

34
The North Slope The Canadian Rockies USA Rockies USA Gulf Coast

36
Texas 396 Oklahoma 76 Louisiana 159 Colorado 38 New Mexico 49 Wyoming 39 Utah 17 Arkansas 39 California 22 Mississippi 8 North Dakota 48 Arizona 0 Nevada 2 Kansas 25 Montana 3 Idaho 0 Alabama 6 Illinois 0 Indiana 2 Ohio 8 Kentucky 11 Michigan 0 New York 3 Tennessee 1 South Dakota 0 Nebraska 2 Oregon 1 Washington 2 Minnesota 0 Iowa 0 Missouri 0 Wisconsin 0 Pennsylvania 56 West Va 21 Virginia 5 Florida 0 Georgia 0 North Carolina 0 South Carolina 0 Maine 0 USA Rig Counts = 1,041 Gulf of Mexico - 32 NH VT Mass Conn NJ MD Alaska 6 Oil Rigs > 305 Gas Rigs > 726

41
RigData – Wells Starts USA January – October 2009 Total USA………..…....19,365 Chesapeake Operating….1,027 XTO Energy……………. 725 ConocoPhillips………….. 651 EOG Resources…….…… 592 Anadarko Petroleum..…... 570 SEECO………………….. 437 BP America …………….. 421 EnCana Oil & Gas……… 386 Devon Energy…………... 361 Noble Energy …………... 354

69
Federal Fund Rate

72
9 th largest body of water in the world

73
810 nautical miles

74
The Shelf

75
The Slope

76
***

78
Sigsbee Deep 14,383 ft deep 0’ - 460’

80
Mariana Trench

81
Challenger Deep 36,000/ft

82
Thanks for your time.

Similar presentations


44% b)53%>")


 Mrs. Benedetto’s 4 th Grade Social Studies.>")
 Study Cards The East (12) New Hampshire New York Massachusetts Delaware Connecticut New Jersey Rhode Island Rhode Island Maryland.>")